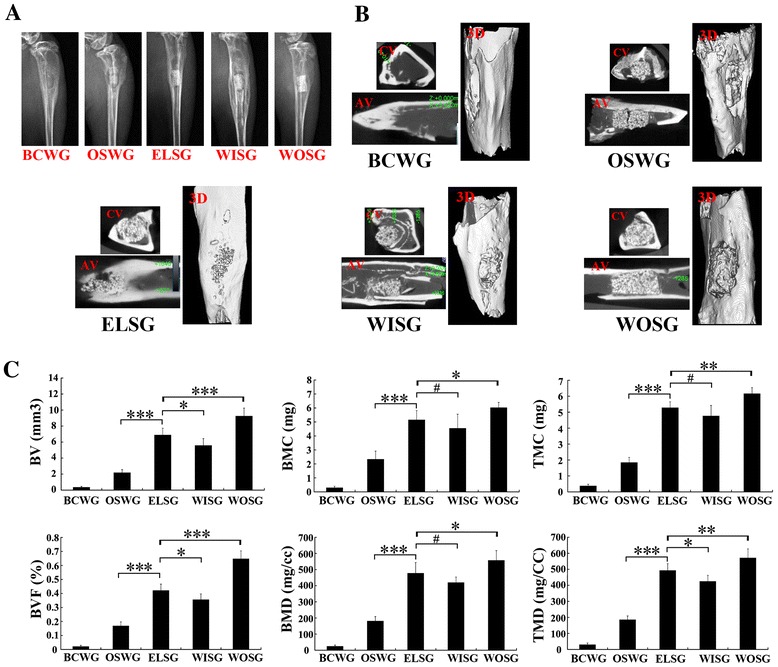
Fig. 6.

Radiographic observation and micro-CT analysis on the osteogenesis of grafts 1 month post implantation. a X-ray observation. b Axial view scanning, coronal view scanning, and three-dimensional reconstruction by micro-CT 1 month post implantation. c Quantitative analysis of osteogenesis in grafts. Data presented as mean ± SD. *p <0.05, **p <0.01, ***p <0.001, ****p <0.0001, # p >0.05; n = 3. AV axial view, BCWG blank control without grafts implantation group, BMC bone mineral content, BMD bone mineral density, BV bone volume, BVF bone volume fraction, CV coronal view, 3D three dimensional, ELSG empty lentiviral vectors transduction hMSCs/scaffold group, OSWG only scaffold without cells implantation group, TMC tissue mineral content, TMD tissue mineral density, WISG Wnt11 RNAi hMSCs/scaffold group, WOSG Wnt11-overexpressing hMSCs/scaffold group
