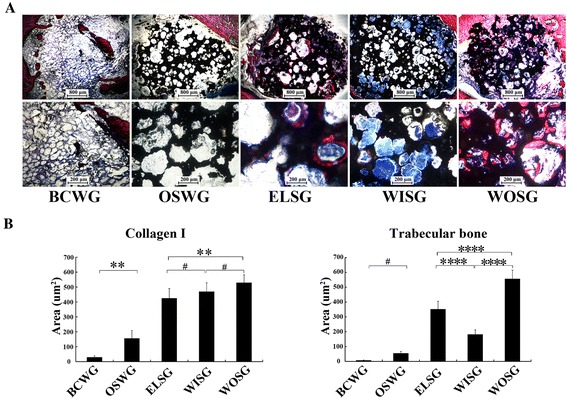
Fig. 8.

Histological evaluation of grafts 1 month after implantation. a VG staining; collagen I and trabecular bone shown in blue and red, respectively. b Quantitative analysis based on the area of new bone tissue. Data presented as mean ± SD. **p <0.01, ***p <0.001, ****p <0.0001, # p >0.05. BCWG blank control without graft implantation group, ELSG Empty lentiviral vectors hMSCs/scaffold group, OSWG only scaffold without cell implantation group, WISG Wnt11 RNAi hMSCs/scaffold group, WOSG Wnt11-overexpressing hMSCs/scaffold group
