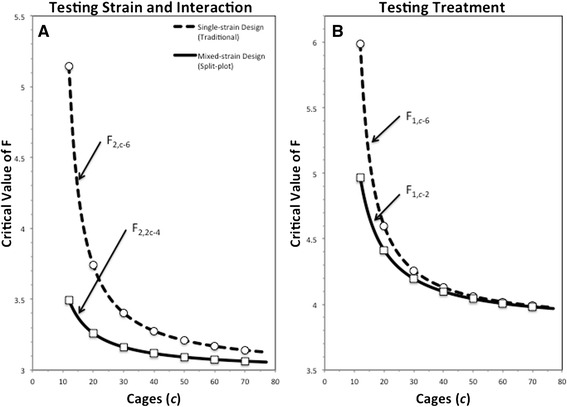
Fig. 1.

Shown are the critical values of F needed to reject the null hypothesis at the α = 0.05 level for two hypothetical experiments testing the effects of a treatment vs. a control on three strains of mice. Smaller values for the critical F imply greater statistical power. The graphs start at 12 cages, as this is the fewest number of cages that can be used in a balanced, single-strain design with at least two replicates. A) illustrates strain and strain*treatment effects and B) illustrates treatment effects (e.g. enrichment)
