
Fig. 3.
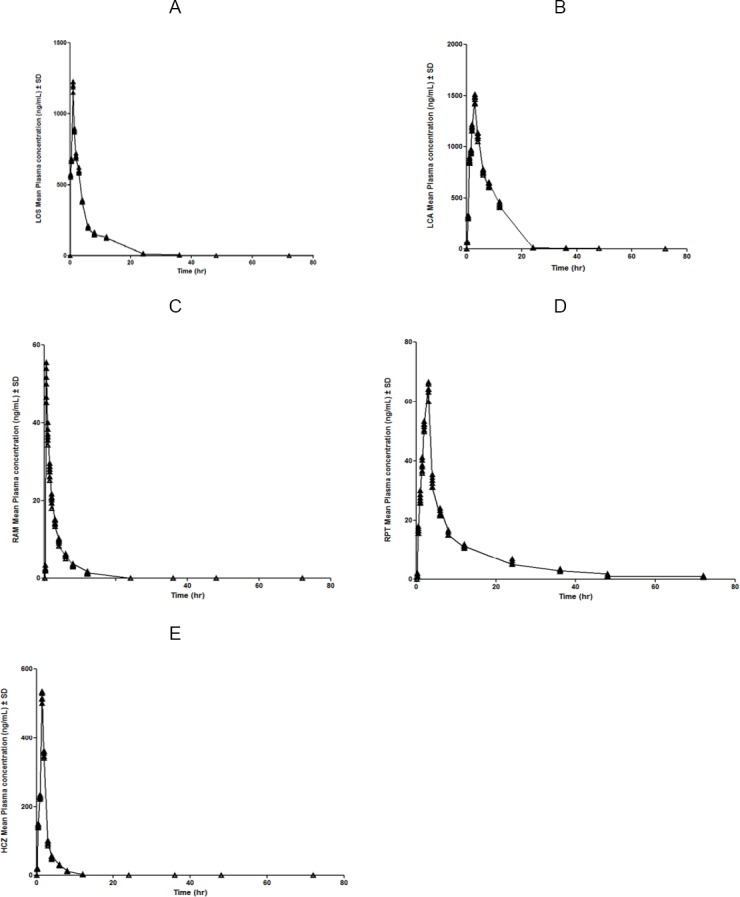
Mean plasma concentration vs. time curve of LOS (A), LCA (B), RAM (C), RPT (D), and HCZ (E) after oral administration of a mixture of LOS (10 mg/kg), RAM (1 mg/kg), and HCZ (2.5 mg/kg) in rats
Official websites use .gov
A
.gov website belongs to an official
government organization in the United States.
Secure .gov websites use HTTPS
A lock (
) or https:// means you've safely
connected to the .gov website. Share sensitive
information only on official, secure websites.
Mean plasma concentration vs. time curve of LOS (A), LCA (B), RAM (C), RPT (D), and HCZ (E) after oral administration of a mixture of LOS (10 mg/kg), RAM (1 mg/kg), and HCZ (2.5 mg/kg) in rats