. Author manuscript; available in PMC: 2016 Sep 1.
Published in final edited form as: Depress Anxiety. 2015 Aug 19;32(9):671–683. doi: 10.1002/da.22403

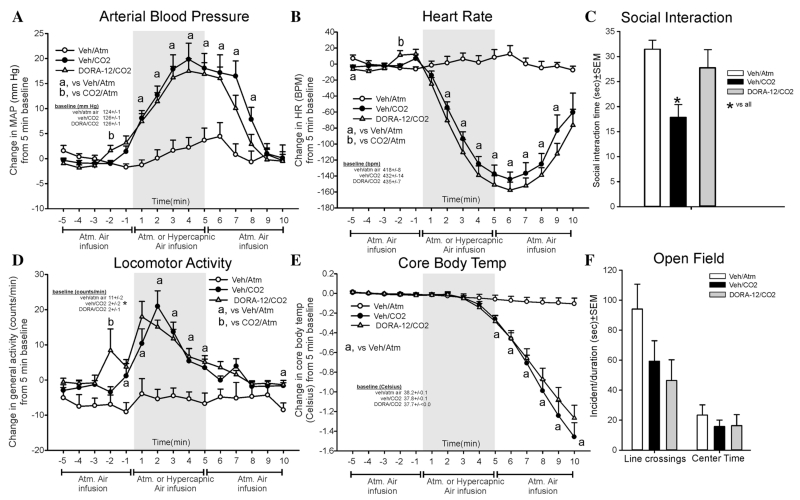
Figure 3. Line graphs indicate the effects of systemic oral gavage of 30 mg/kg of DORA-12 on 20% CO2-induced changes (from 5 min baseline) in (a) MAP (mm Hg), (b) HR (beats/min, BPM), (d) general locomotor activity (counts/min), and decreased CBT (Celsius) in freely moving rats surgically implanted with radiotelemetry probes. There were no significant differences in baseline MAP, HR, or CBT (see legends on figures with baselines ± SEM). However, there were differences noted in the baseline general locomotor activity (see baseline legend in Fig. 3D). Gray shaded area represents the 5 min CO2 or atmospheric air challenge, where atmospheric air was also infused prior to and after for 5 min (also indicated at bottom of x-axis). Bar graphs indicate the effects of systemic oral gavage of 30 mg/kg of DORA-12 on 20% CO2-induced changes in (c) SI in the SI test, and (f) line crossings and center time in the open field test. *, Between subjects differences using a Fisher’s LSD post hoc test that was protected with a repeated measures ANOVA and an ANOVA at each time point.

Figure 3