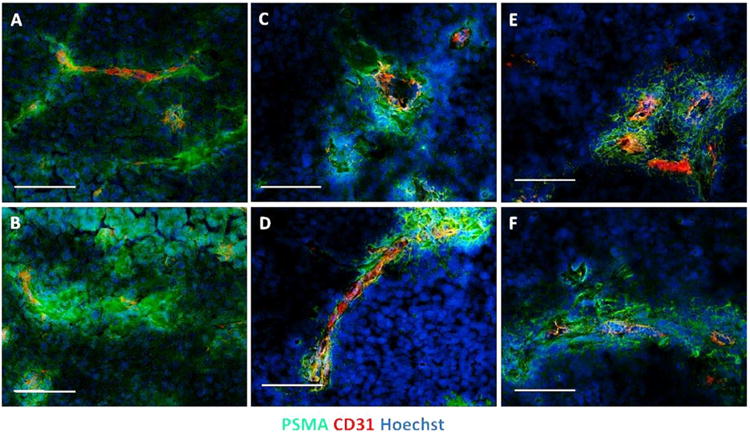
Fig. 7.

Proximal expression of PSMA in context with CD31 expression in LNCaP, JHU-LNCaP-SM, and C4-2 tumor xenografts. PSMA and CD31 expression patterns were determined using immunofluorescence microscopy upon primary tumor xenograft sections. (A and B) LNCaP tumors are represented, (C and D) represents JHU-LNCaP-SM tumors, and (E and F) depicts C4-2 xenograft tumors. Markers and channels are as indicated and are optimized for intensities individually. Scale bar = 100 μm.
