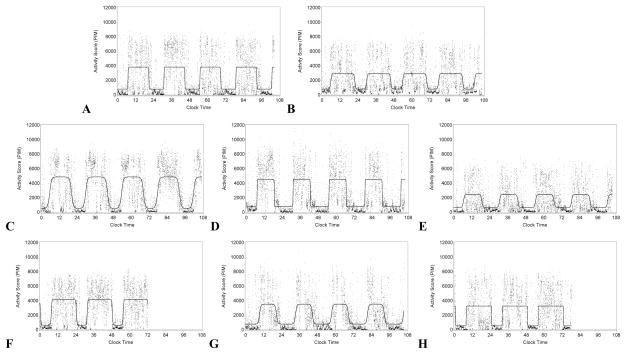
Figure 1. Modeled activity rhythms of eight men representing the data-derived sub-groups.
Activity data is plotted over time and the modeled rhythm is plotted in red. The eight men belonged to the following groups: Panel A, Normal rhythm; Panel B, Low activity; Panel C, Early activity; Panel D, Early/short active period; Panel E, Early/short active period/dampened; Panel F, Late activity; Panel G, Late/short active period; Panel H, Late/low activity

