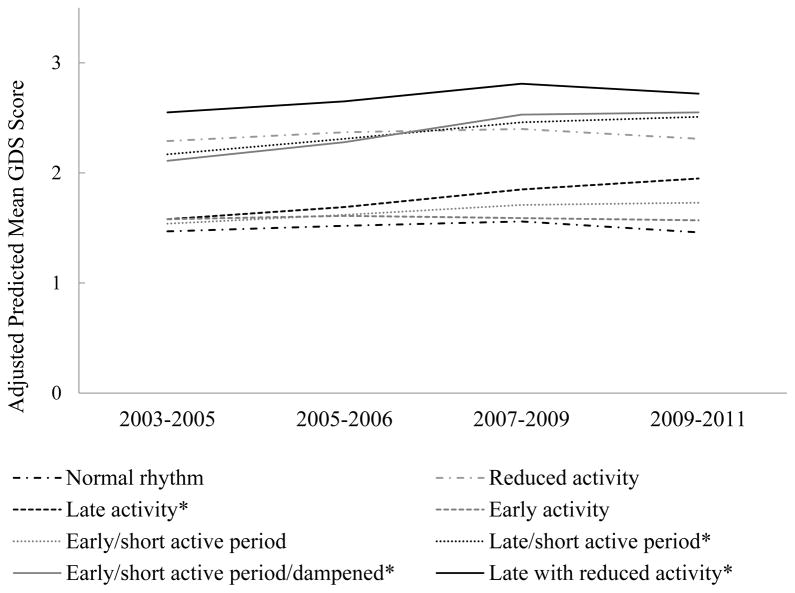
Figure 2. Adjusted predicted mean GDS scores by CAR sub-groups over time.
Note the scale of the y-axis was modified from that of the GDS (range: 0–15) to visually illustrate the significant interactions wherein four CAR sub-groups (marked with a *) have greater average subject-specific slopes by CAR sub-group compared with the normal rhythm group.

