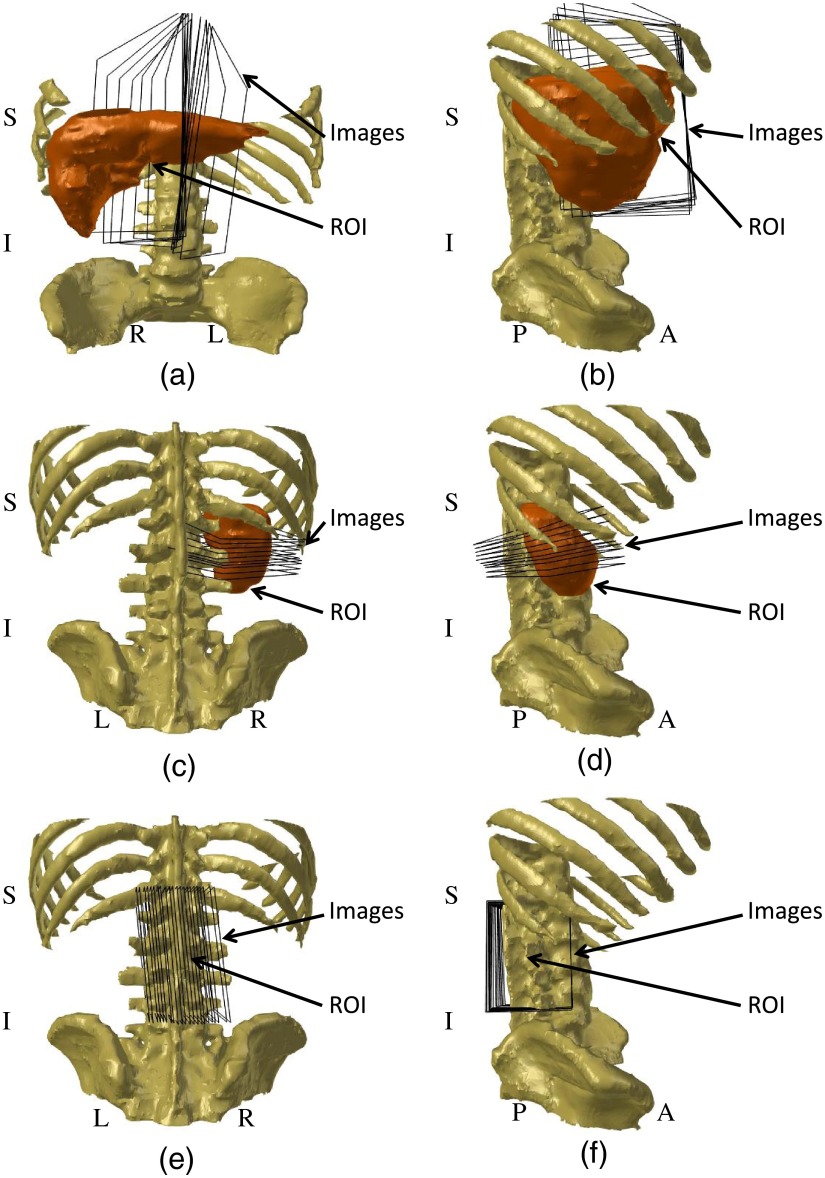
Fig. 5.
Schematic diagrams showing ultrasound image orientation with respect to the region of interest (ROI). (a) Frontal view of liver image acquisition. (b) Right lateral view of liver image acquisition. (c) Dorsal view of kidney image acquisition. (d) Right lateral view of kidney image acquisition. (e) Dorsal view of spine image acquisition. (f) Right lateral view of spine image acquisition. The ROI labels show only the organs/bones of interest, and not specific locations within or on them. All diagrams were prepared using the anatomical atlas from Talos et al.27, and are intended only for general visualization.

