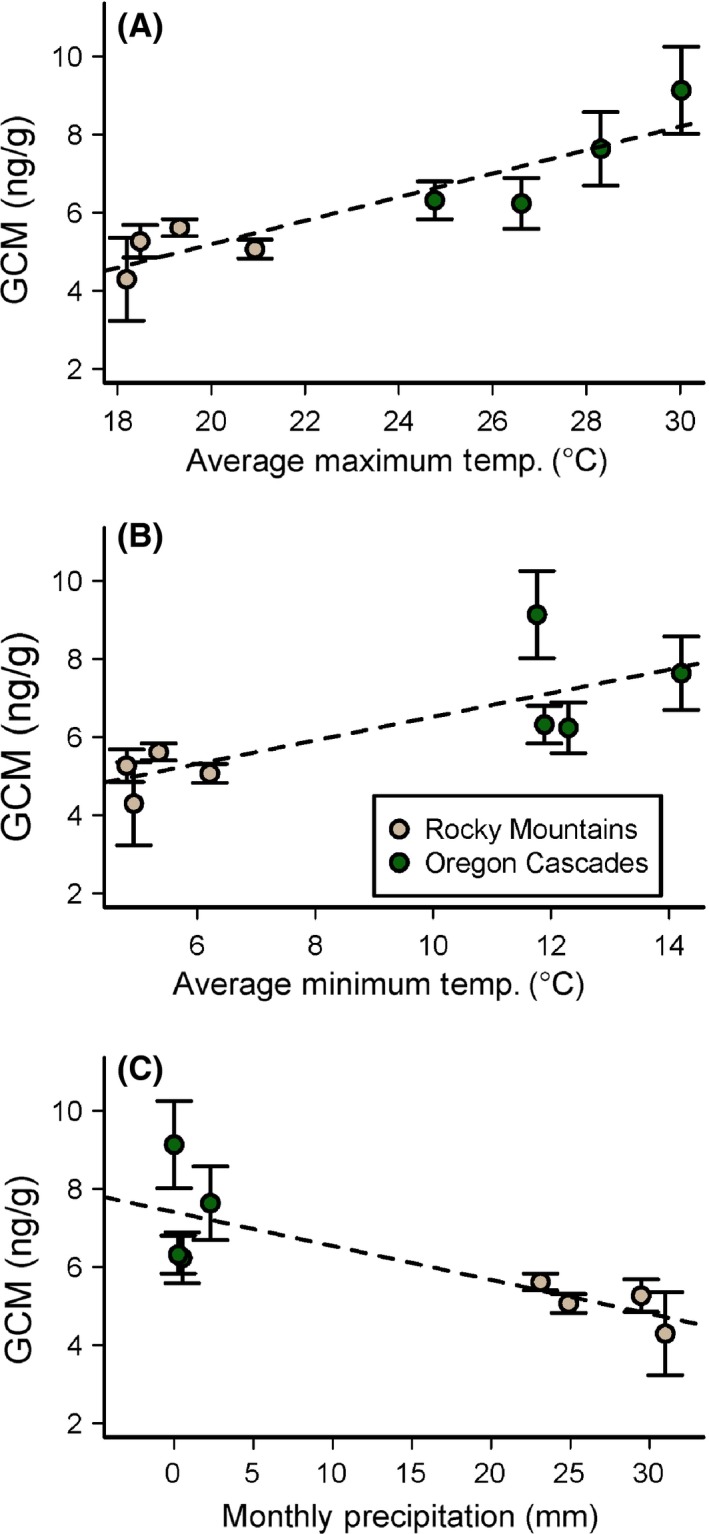
Figure 3.

Mean and standard error of glucocorticoid metabolite (GCM) concentration measured in samples exposed at eight different sites in two eco‐regions, relative to (A) maximum temperature, (B) minimum temperature, and (C) precipitation during the month of exposure. Point color reflects eco‐region.
