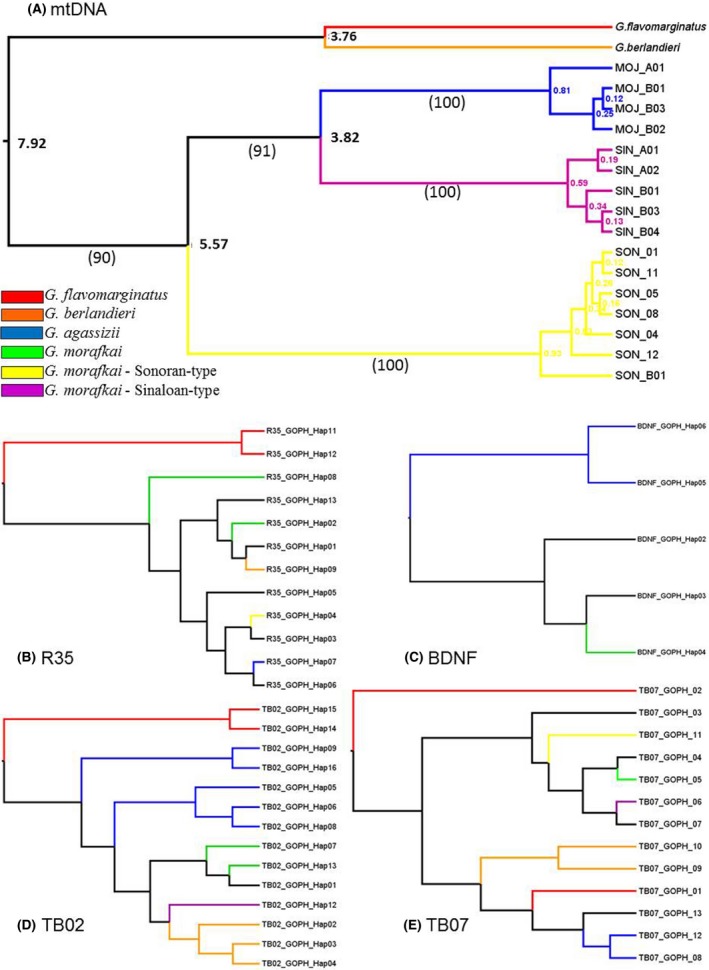
Figure 2.

Bayesian reconstructions of representative nuclear and mtDNA haplotypes using BEAST; Colored branches indicate haplotypes fixed in designated lineages. (A) mtDNA nodes labeled with estimated time to most recent common ancestor (TMRCA) in millions of years. Bootstrap values in parentheses estimated from parsimony reconstruction. (B–E) nDNA allele networks rooted at midpoint of the greatest distance to present tree‐like associations.
