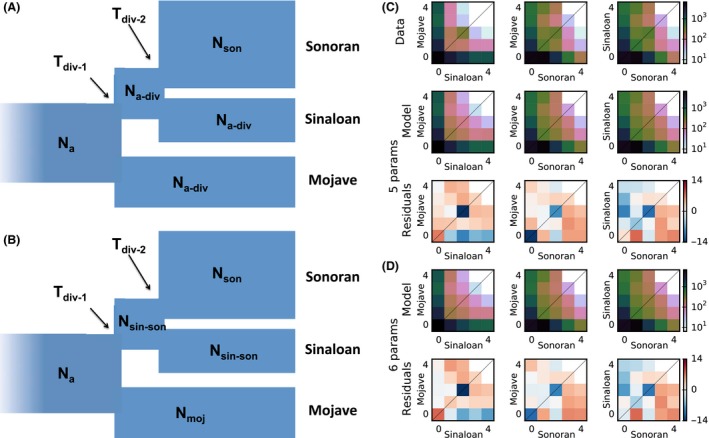
Figure 5.

Best‐fit demographic models and observed and predicted frequency spectra for Mojave, Sinaloan, and Sonoran desert tortoise populations. (A) Simpler model fit with the five free parameters labeled. (B) More complex model, with the 6 free parameters labeled. (C, D) The marginal spectra for each pair of populations. Row one is data, rows two and four are models, and rows three and five are Anscombe residuals of model minus data. Ns represent effective population sizes and Ts represent times of population divergence.
