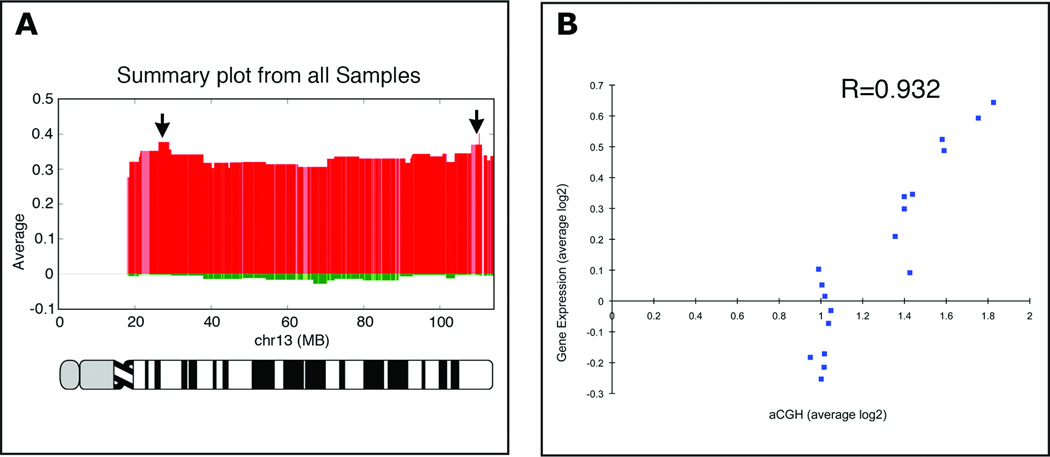
Figure 1. Genomic aberration profile, chromosome specific gene expression, and their correlation.
(A) Genomic aberration profile of chromosome 13 in primary colorectal carcinomas established using aCGH. This chromosome is consistently gained. Note two distinct peaks of genomic amplification (arrows). Numbers on the x-axis denote genomic coordinates, and on the y-axis shows the values of average copy number changes in log2 ratios. (B) Correlation between aCGH and resident gene expression levels. Plotted here are 18 samples for which we had concordant data on genomic copy number and gene expression levels. Gene expression levels were correlated with genomic copy number for samples with no gain of chromosome 13 (those that map in the range of 1 on the x-axis), and in a linear fashion for those with increasing genomic amplification (R=0.932).

