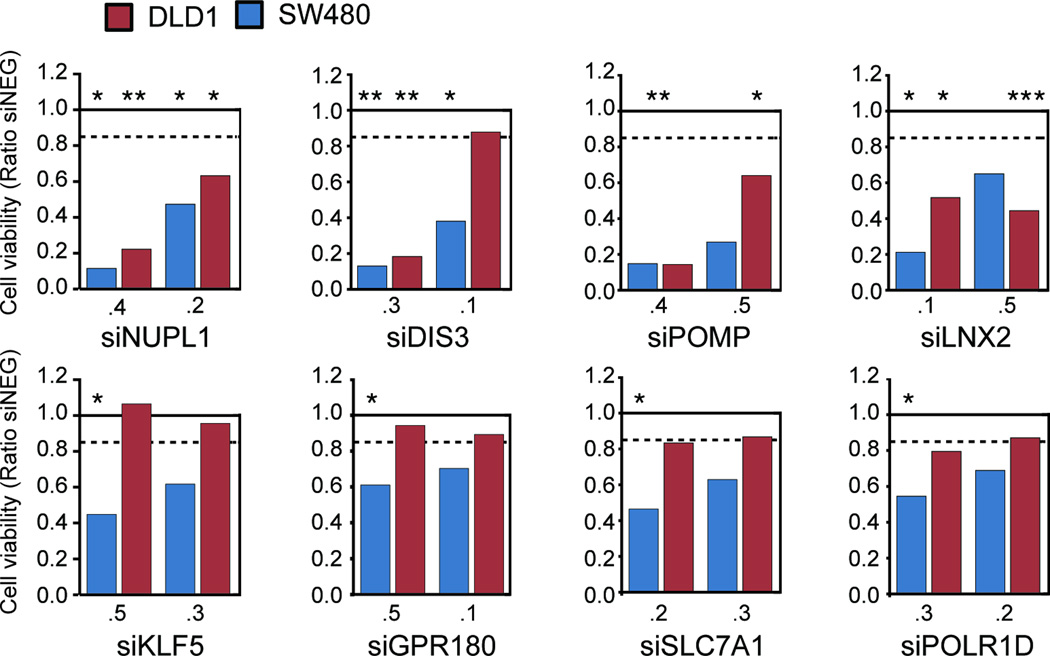
Figure 2. Viability of the cell lines SW480 and DLD-1 after silencing of candidate genes.
The graph shows the results of silencing of the eight candidate genes (as a ratio of siNeg transfected cells) following RNAi (here shown the results for the two siRNAs used for subsequent experimentation) in SW480 and DLD-1. The solid line indicates the normalization against siNeg transfected cells, the dotted line the threshold of 15% reduction in viability as measured with the CellTiter-Blue assay. The statistical comparison (t-test) is based on the comparison to siNeg transfected cells (* P≤0.05, ** P≤0.01, *** P≤0.001).

