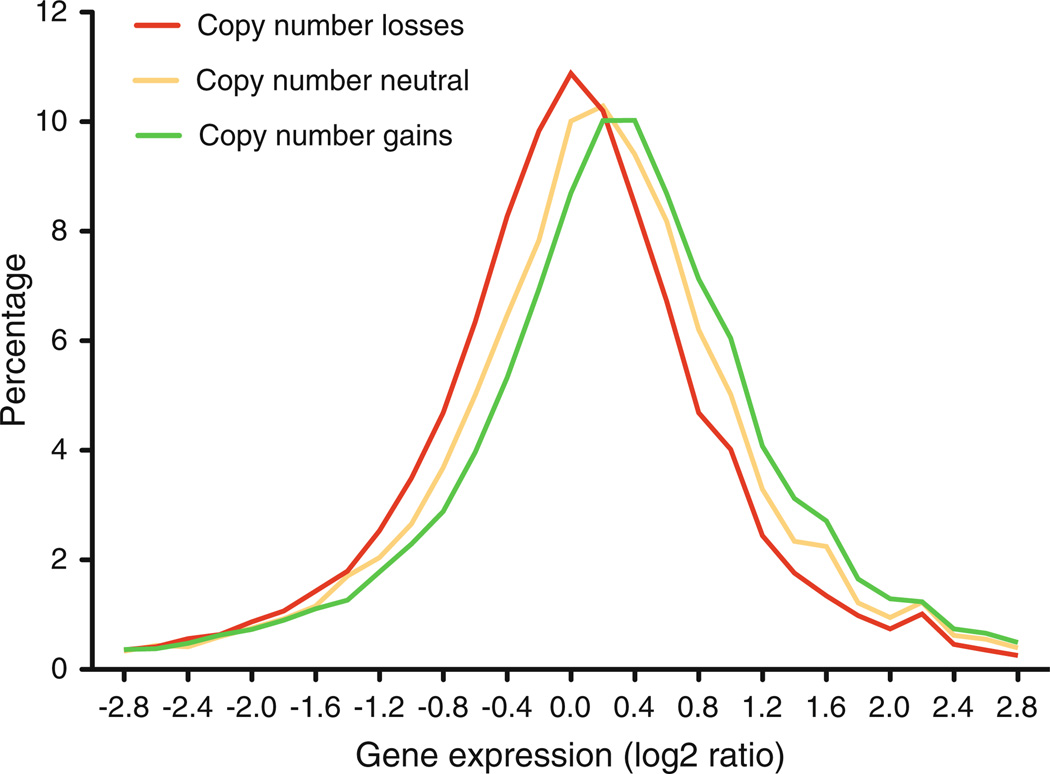
Fig. 4.
Plot showing the correlation between copy number changes and gene expression from a set of colorectal cancers. In yellow, genomic segments that are copy number neutral; in red, genomic segments that show a copy number reduction; and in green, genomic segments that show a copy number gain. The Y-axis indicates the levels of gene expression in log2 ratio. (Adapted from Ried et al. 2012)

