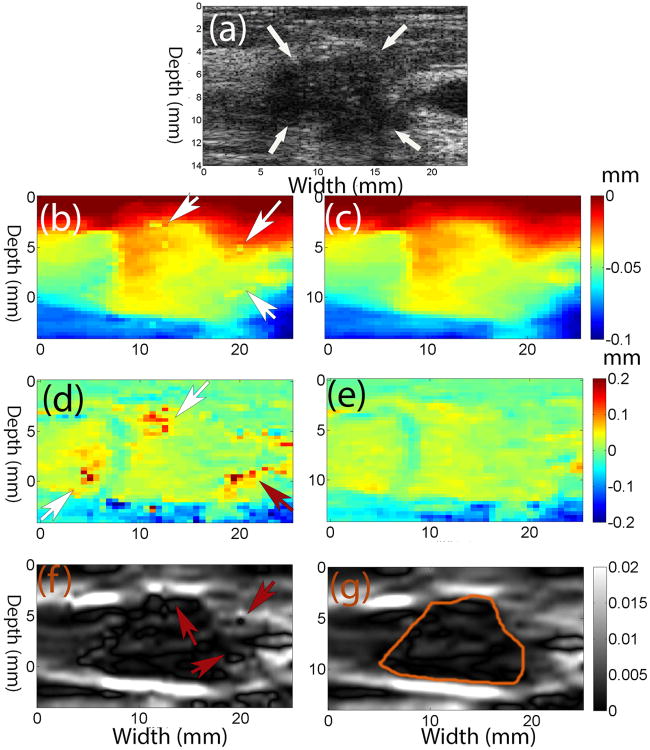
Fig. 3.
a) B-mode image of an in vivo invasive ductal carcinoma (IDC), (b), (d) and (f) axial and lateral displacement (in mm) and axial strain images obtained using the 2D quadratic interpolation method, respectively, compared to (c), (e) and (g) those obtained using the coupled tracking method. The arrows in (a) point to the IDC, while arrows in (b), (d) and (f) point to the possible tracking errors. The contours in axial strain images were the segmented target boundaries and were used for calculations of CNRs.

