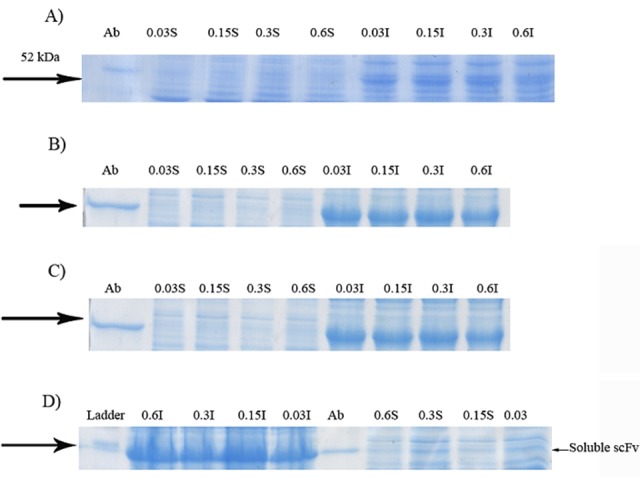
Figure 1.

Effect of cultivations at the presence of different concentrations of lactose on soluble expression of GST-hD2. Proteins were resolved on SDS-PAGE prepared using 12% acrylamide and visualized by Coomassie Brilliant Blue G250 29. Cells grown at 10 °C. The digital part of the alphanumerical codes above the lanes show the concentrations of lactose. (S) and (I) symbols of the code denote soluble and insoluble fractions, respectively. Gels in panels A, B, C and D show the results for 3, 6, 24 and 48 h inductions, respectively.
