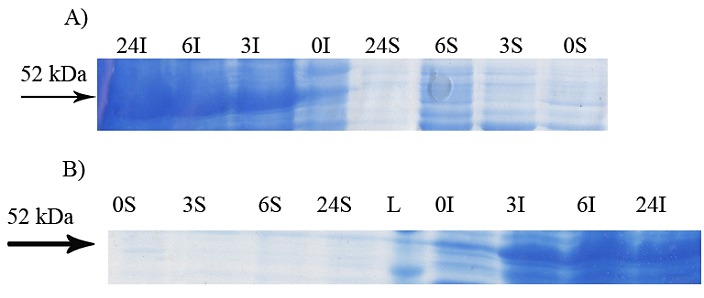
Figure 2.

Effect of cultivations at different incubation time on soluble expression of GST-hD2. The cells were induced by 0.1 mMIPTG at 20 °C (panel A) and 37 °C (Panel B). The digital part of the alphanumerical codes above the lanes show incubation times after induction. (L), (S) and (I) symbols of the code denote 50 kDa ladder, soluble and insoluble fractions, respectively.
