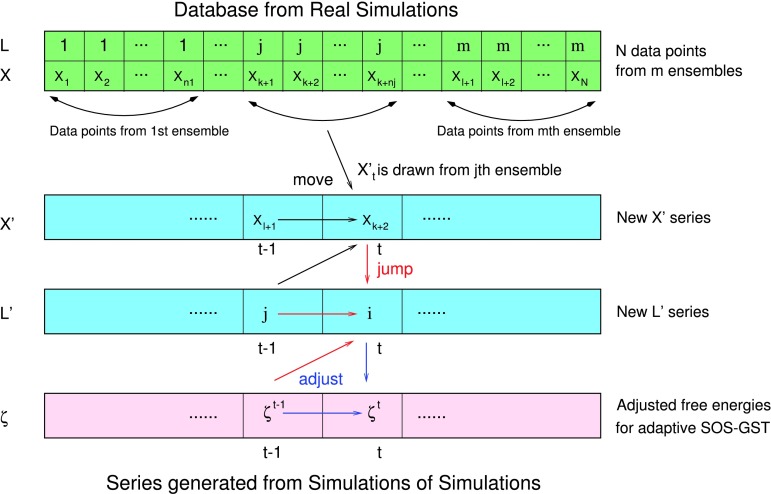
FIG. 1.
Schematic representation of SOS-GST (first two steps) and adaptive SOS-GST (three steps): (1) black arrows show the move process in the configuration space; (2) red arrows denote the jump process in the thermodynamic state space; and (3) blue arrow represents the additional operation of adjusting the hypothesized free energies in the adaptive SOS-GST procedure.

