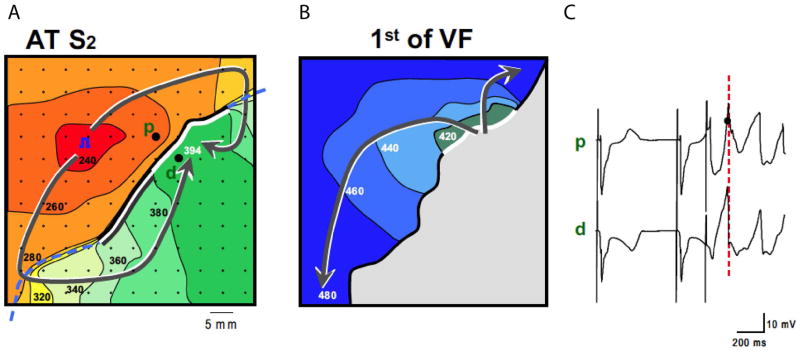
Figure14_2.
Electrical mapping of ventricular fibrillation. At the right, an activation map is reconstructed of a premature beat (following S2). In the middle, the activation pattern is reconstructed VF is induced, because local distal activation coincided with local proximal repolarization. The dashed line indicates the epicardial interface between the perfusion beds. Small dots indicate electrode positions. Bold dots indicate positions from which electrograms (right panels) were recorded (p, proximal; d distal). Lines are 20 ms isochrones. Red dotted vertical line in the electrograms indicate the moment of distal activation. This figure is a courtesy of Dr. Ruben Coronel.[73]

