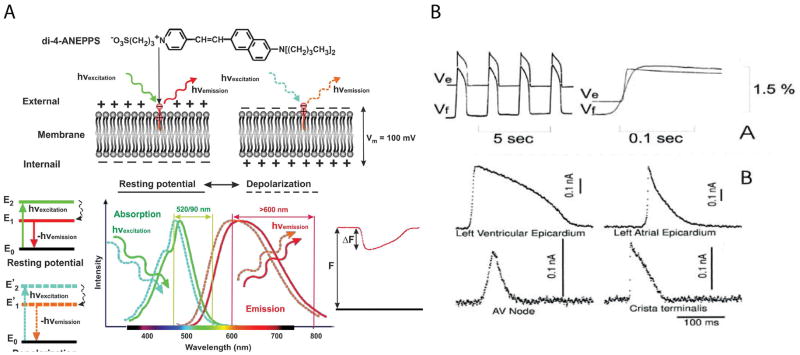
Figure14_3.
Optical recording of cardiac action potentials using fluorescent dyes. A. The upper panel illustrates the conformation change of di-4-ANEPPS upon a change in membrane potentials. The lower panel shows the shift in emission spectrum results in a change in the amount of recorded fluorescence. B. The upper panel, Simultaneous fluorescent (Vf) and microelectrode (Ve) recordings of action potentials in the frog heart stained with Merocyanine- 540. The lower panel, Optical recording of action potentials from different regions of the heart stained with di-4-ANEPPS: ventricular and atrial working myocardium, AV node, and Crista terminalis. Modified from Boukens et al and Efimov et al.[27, 74]

