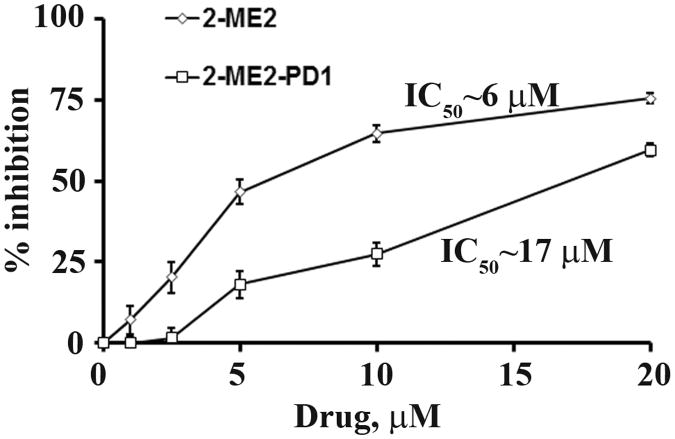
Figure 3. The differential effect of 2-ME2 and 2-ME2-PD1 on OE33 cell proliferation in vitro.
Approximately 60-70% confluent OE33 cells were grown in the presence or absence of indicated concentrations of 2-ME2 or 2-ME2-PD1 for 48 h, and cellular viability/proliferation was determined using crystal violet dye colorimetric assay. The values with error bars are expressed as mean ± standard deviation (SD) of three independent experiments P- values were determined by Student's t-test. *P <0.001; **P<0.0001 versus control.

