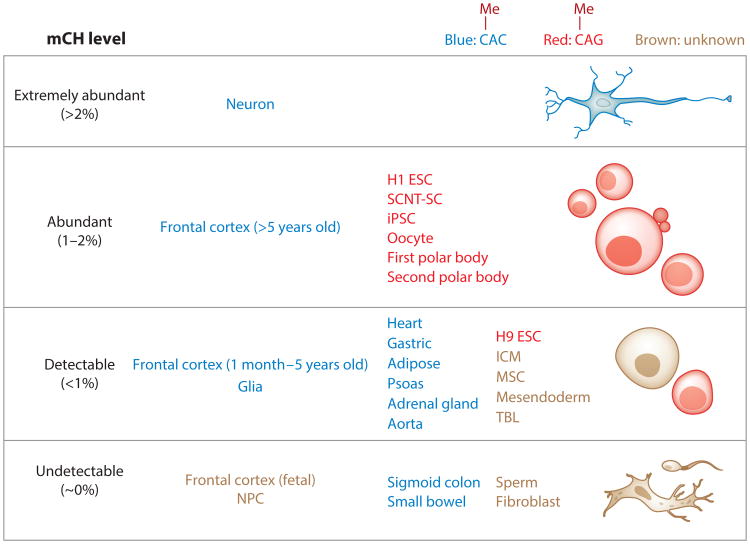
Figure 1.
mCH abundance in human cells and tissues. To estimate the abundance, genome-wide mCH levels (83) were calculated as previously described (56) using whole-genome bisulfite sequencing data. Based on these mCH levels, cells and tissues were then divided into four categories: extremely abundant (>2%), abundant (1–2%), detectable (<1%), and undetectable (∼0%). Note that cells and tissues labeled as undetectable have mCH levels that are very close to the background bisulfite nonconversion rate. In the last two categories (detectable and undetectable), only representative cells and tissues are shown, whereas the first two categories (extremely abundant and abundant) contain all qualified cells and tissues based on current knowledge. These cells and tissues are also grouped into three categories by whether the observed mCH occurs primarily in a CAC sequence context (blue) or a CAG sequence context (red) or the sequence preference is unknown (brown). Data for neurons, glia, and frontal cortex are from Lister et al. (54); whole-genome bisulfite sequencing data for H1 ESCs, MSCs, NPCs, TBLs, mesendoderm, and fibroblasts are from Lister et al. (56) and Xie et al. (106); methylome data for H9 ESCs are from Laurent et al. (48); data for SCNT-SCs and iPSCs are from Lister et al. (57) and Ma et al. (61); data for the sigmoid colon, small bowel, heart, gastric system, adipose tissue, psoas, adrenal gland, and aorta are from Schultz et al. (82); and data for the remaining samples (sperm, oocytes, polar bodies, and ICM) are from Guo et al. (31). Abbreviations: ESC, embryonic stem cell; ICM, inner cell mass; iPSC, induced pluripotent stem cell; mCH, non-CG methylation; MSC, mesenchymal stem cell; NPC, neural progenitor cell; SCNT-SC, somatic cell nuclear transfer stem cell; TBL, trophoblast-like cell.

