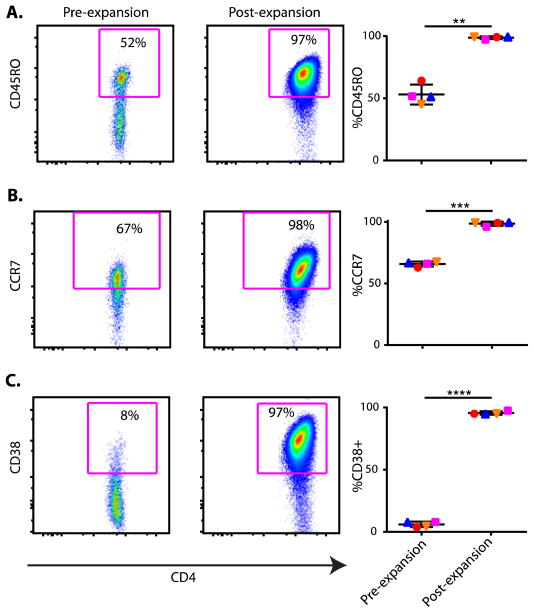
Fig. 2. Increased expression of CD45RO, CCR7, and CD38 on Tregs after in vitro expansion.
CD4+CD25+CD127loTregs, as shown in Supplemental Figure S6, were stained for (A) CD45RO, (B) CCR7, and (C) CD38 before and after expansion. Representative FACS plots are shown for each of these stains on the left and graphs plotting data for all subjects (n=4) on the right. Data points for each subject are represented in a unique and consistent symbol (blue upright triangle, red circle, orange inverted triangle, and magenta square). Significance was determined by paired t test and indicated with an asterisk. **P = 0.0014, ***P = 0.0001, and ****P < 0.0001

