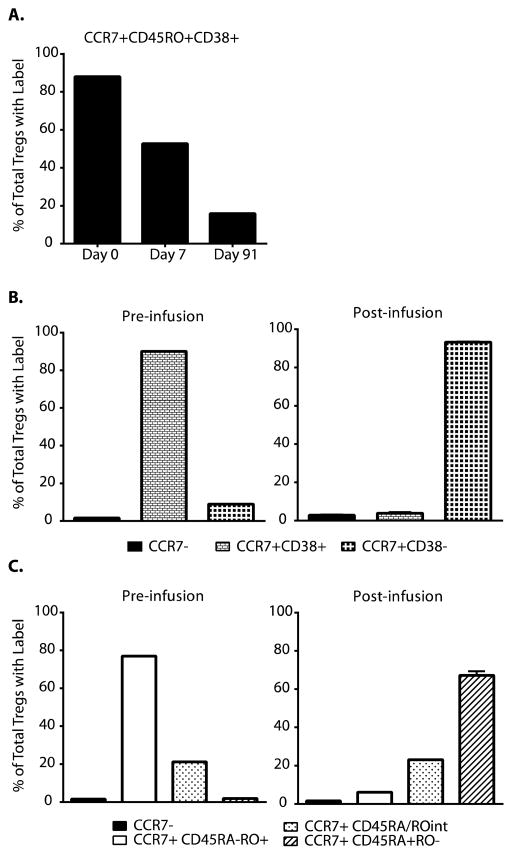
Fig. 7. Changes in Tregs phenotypes after transfer.
Frozen samples of expanded Tregs or PBMC collected at time points on days 7–91 post infusion were FACS sorted for CD4+CD25+CD127lo Tregs. These Tregs were further subsetted and sorted based on expression of CCR7, CD38, CD45RA, and CD45RO. Collected Tregs subsets were then analyzed by mass- spectrometry for 2H-label, which was incorporated into the infused Tregs during the expansion. (A) CCR7+CD45RO+CD38+ Tregs (black bars) were analyzed for %enrichment, which represented an increasingly smaller proportion of total Treg 2H enrichment over time. (B) Tregs were subsetted into CCR7− (black bars), CCR7+CD38+ (small grid bars), and CCR7+CD38− (large grid bars) populations for 2H enrichment analysis pre and post infusion. (C) Tregs were subsetted into CCR7− (black bars), CCR7+CD45RA−CD45RO+ (white bars), CCR7+CD45RAintCD45ROint (speckled bars), and CCR7+CD45RA+CD45RO− (striped bars) populations for 2H enrichment analysis pre and post infusion. All plots shown are representative of data collected from subjects in cohort 4. “% of Total Tregs with Label” is defined is Supplemental Figure S8.

