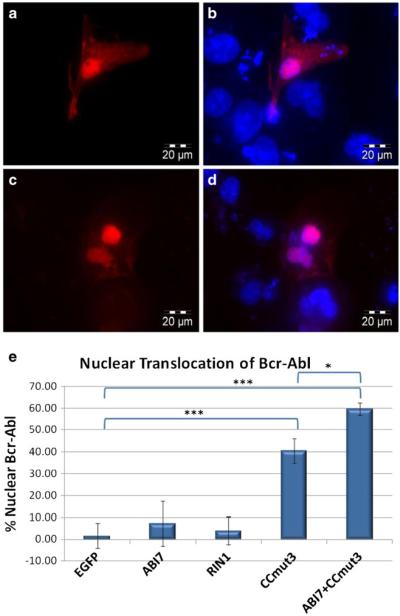
Fig. 8.
Representative images of nuclear Bcr-Abl resulting from 4NLS-CCmut3, and quantification of nuclear Bcr-Abl from all 4NLS constructs. (a) To more clearly show the nuclear accumulation of Bcr-Abl upon cotransfection with 4NLS-CCmut3, an image of only the red fluorescence (Bcr-Abl) is shown. (b) The image shown in (a) is shown with the nuclear stain (H33342, blue). (c) Resulting Bcr-Abl localization after transfecting 4NLS ABI7 with 4NLS CCmut3. (d) Image from (c) with nuclear stain. (e) The percentages of Bcr-Abl found in the nucleus after cotransfection with the indicated constructs was quantified and graphed. At least five cells from each experiment were imaged and analyzed. Each construct was cotransfected with pmCherry Bcr-Abl three times. Statistical analysis was determined by one-way ANOVA with Tukey’s post test. *p <0.05, ***p< 0.001.

