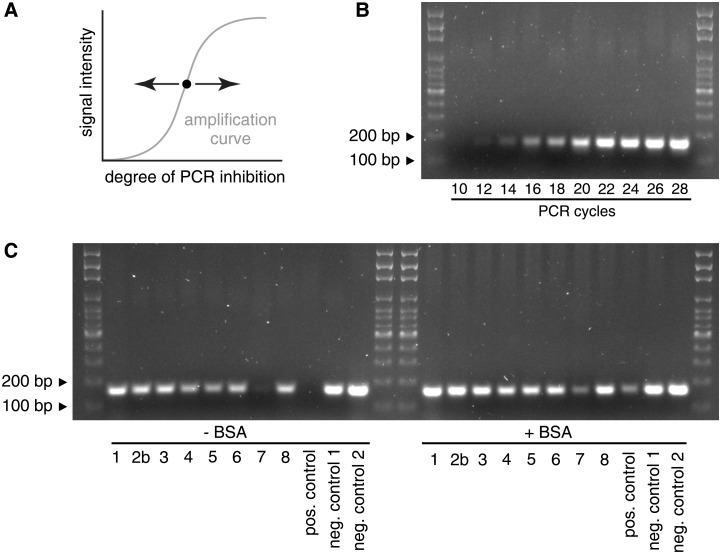
Fig 10. Testing environmental samples for PCR inhibition.
(A) Conceptual illustration of an inhibition testing PCR. An inhibition testing PCR is set up so that its endpoint is placed in the linear phase of a PCR amplification. Changes in the degree of PCR inhibition, template or cycle number will therefore result in changes in signal intensity. For a PCR with an endpoint as indicated by a black dot, more inhibition would result in lower signal intensity, and less inhibition would result in higher signal intensity. (B) Determination of the optimal cycle number for the inhibition testing PCR. Between cycles 10 to 28, the amplification curve is in the dynamic range. (C) Inhibition tests using environmental samples. Three microliters of the indicated environmental sample were added to the inhibition testing PCR, and PCR was run for 22 cycles in the absence (left) or presence (right) of BSA as an anti-inhibitory agent. Positive control, 70% EtOH. Negative control 1, ddH2O. Negative control 2, independent DNA preparation isolated with the Qiagen Blood and Tissue kit.

