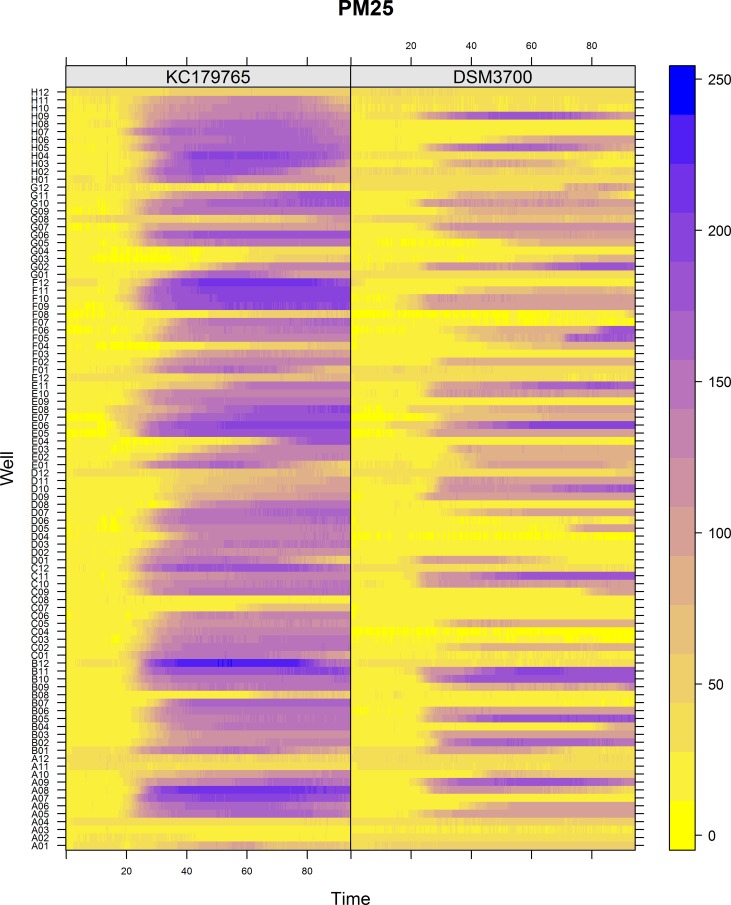
Fig 5. Visualization of N. fischeri DSM3700 and N. fischeri KC179765 growth kinetics on plate PM25.
The growth values are represented by a color range as given in the scale bar on the right of the figure. The growth value increases from the yellow to the blue color. Yellow color represents growth inhibition.

