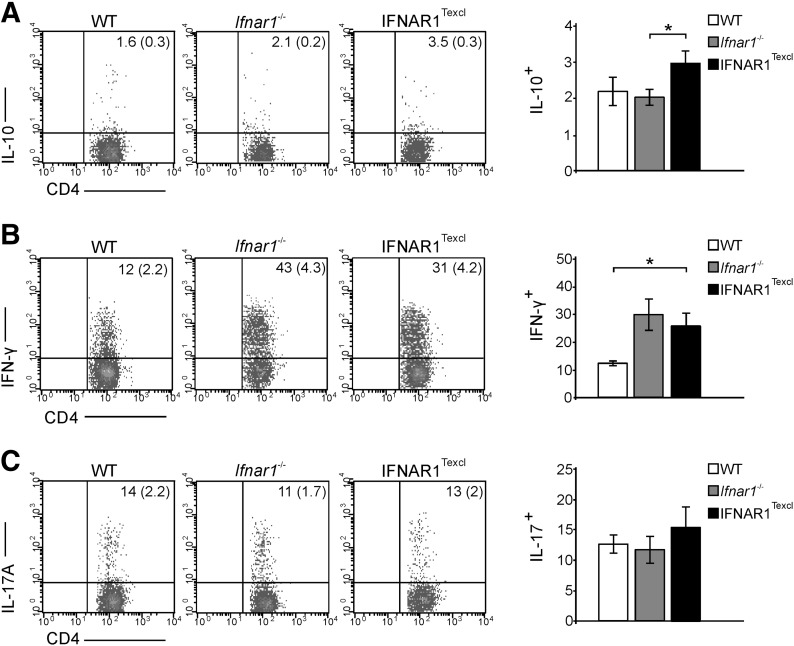
Figure 6. Frequency of cytokine-producing splenic T cells at the acute phase of EAE.
Mice were immunized with MOG35–55 peptide, and on d 17, splenic cells were stimulated with PMA/ionomycin/brefeldin A, stained for intracellular cytokines, and analyzed by flow cytometry. The dot plots and bars represent the IL-10 (A)-, IFN-γ (B)-, and IL-17A (C)-producing cells gated on the CD4+ population (values in the parentheses show percentage in the total live-cell gate). A representative dot plot per genotype is shown. Results are presented as means ± sem and are representative from 2 independent experiments with similar results (n = 5 mice/genotype/experiment). *P < 0.05.

