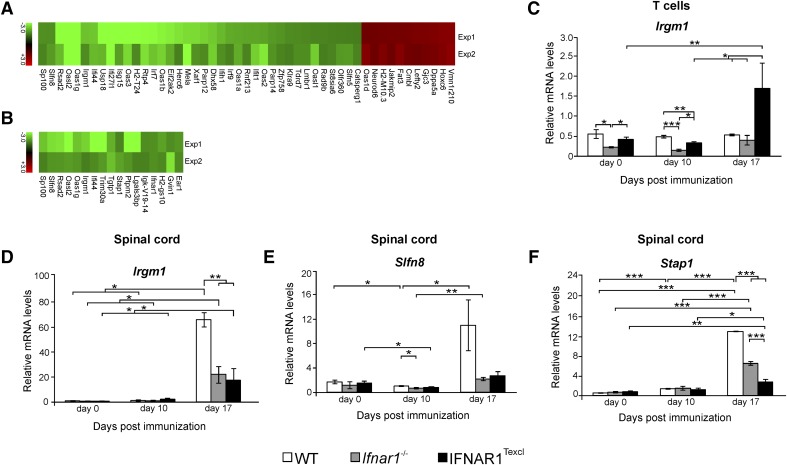
Figure 9. Microarray data analysis and quantitative RT-PCR of CD3+-enriched T cells and spinal cord.
Microarray analysis was performed on RNA from splenic, CD3+-enriched T cells and spinal cords from WT, Ifnar1−/−, and IFNAR1Texcl mice on d 0, 10, and 17 relative to EAE induction. (A and B) Heat map depicting the relative expression of selected genes that are different in expression between IFNAR1Texcl and WT T cells (A) and spinal cord (B) samples and were common in 2 independent experiments. Table 4 shows the function and number of molecules/category, as assessed by DAVID microarray software. The levels of mRNA transcripts for selected genes were measured in T cells (C) and spinal cords (D–F) by quantitative RT-PCR by use of single samples from each group at each time point (d 0: n = 3–5 mice/genotype; d 10: n = 3–4 mice/genotype; d 17: n = 2–3 mice/genotype). The results shown are the means ± sem of samples from 1 representative of 2 independent EAE experiments with similar results.*P < 0.05, **P < 0.01, ***P < 0.001.

