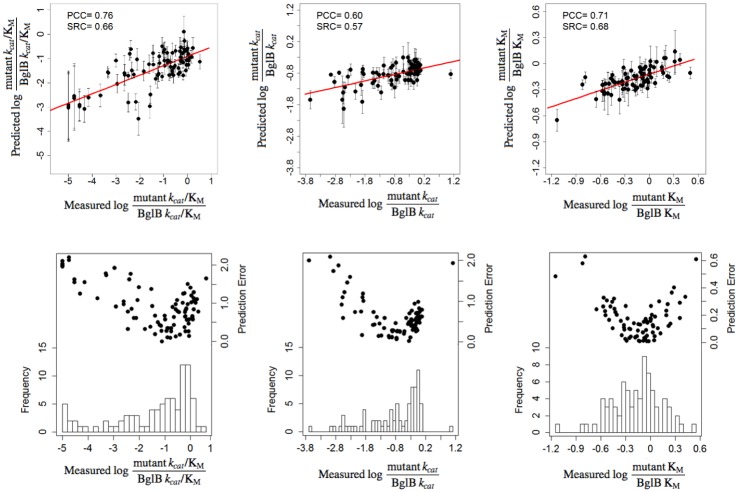
Fig 4. Correlation between machine learning predictions and experimentally-determined kinetic constants.
Top panels: predicted versus experimentally-measured values for kinetic constants kcat/KM (A), kcat (B), and 1/KM (C). All values are relative to the wild type enzyme and on a log scale. The standard deviation (error bars) of the predicted values are calculated based on the prediction by 1000-fold cross validation for each point. The red line corresponds to linear regression and has been added for visualization purposes. Bottom panels: Histograms of experimentally-determined values in the data set (90, 80 and 80 samples for kcat/KM, kcat, and KM, respectively), along with the residual errors (scatter plot) between predicted and measured kinetic values.

