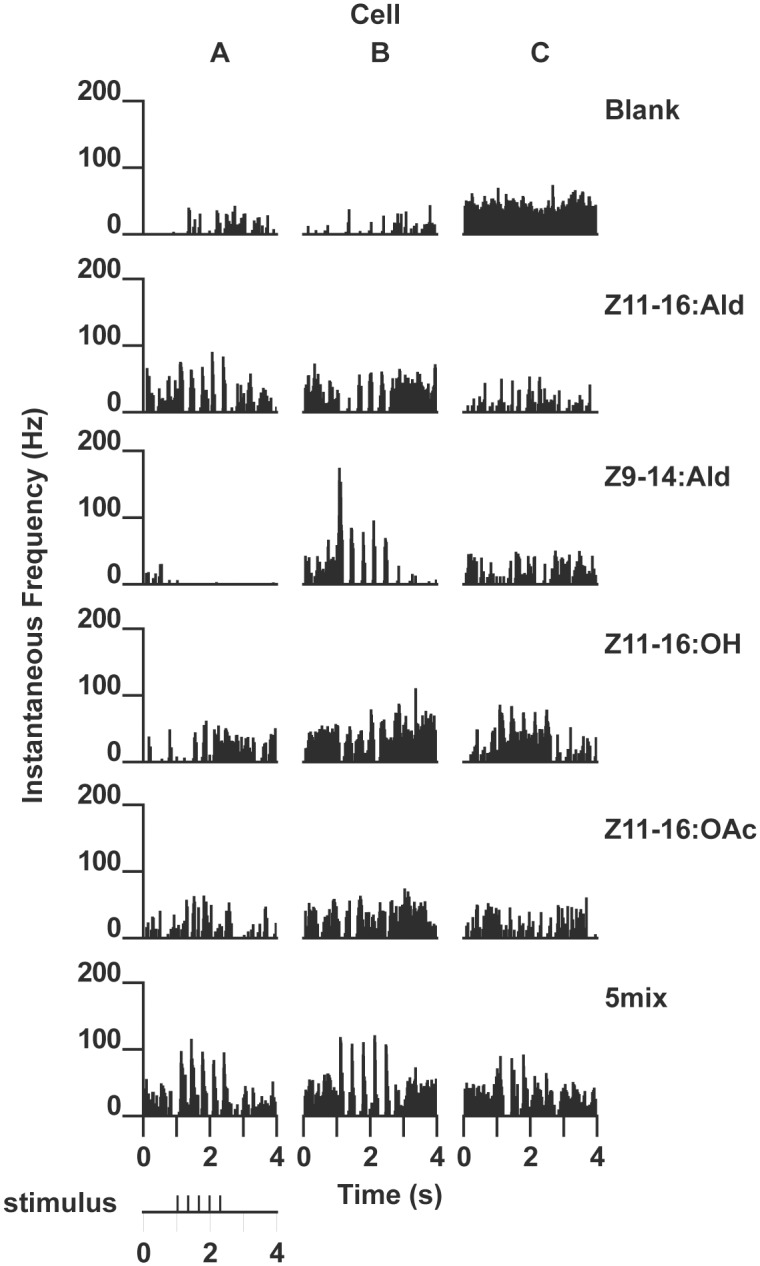
Fig 8. Physiological response profiles of the three projection neurons shown in Fig 7.

Responses are shown as instantaneous frequency plots where responses to stimulation with 5 brief pulses of a specific odorant (or a mixture containing the odorant) result in volleys of action potentials seen as distinct peaks above background. (A) PN specifically responsive to stimulation with Z11-16:Ald or mixtures containing that odorant (morphology shown in Fig 7A). (B) PN specifically responsive to Z9-14:Ald or mixtures with this odorant (morphology shown in Fig 7B). Note strong hyperpolarizing responses to pulses of Z11-16:Ald and Z11-16:OH. (C) PN responsive to Z11-16:OH and blends that contained this odorant (morphology shown in Fig 7C).
