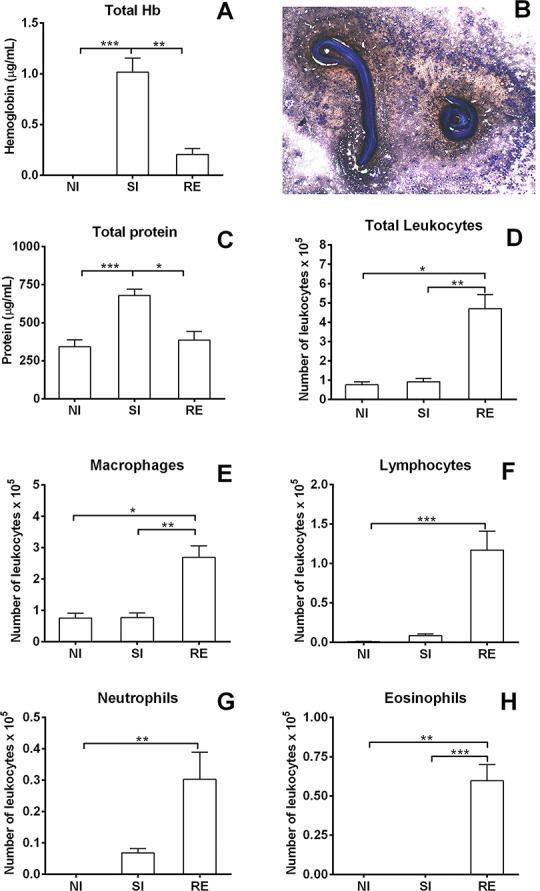
Fig 6. Levels of haemoglobin, total protein, mononuclear and granulocyte cell counts in the BAL on the 8th day post-infection.

(A) Haemoglobin levels in BAL on the 8th day post-infection. (B) Larvae from A. suum surrounded by leukocytes in the BAL 8 days post-infection. (C) Total protein levels in the BAL on the 8th day post-infection. (D) Total leukocytes counts in the BAL on the 8th day post-infection. (E) Macrophage counts in the BAL. (F) Lymphocyte cell counts in the BAL. (G) Neutrophil cell counts in the BAL. (H) Eosinophil cell counts in the BAL. Kruskal-Wallis test followed by Dunn´s multiple comparisons test was used to evaluate differences among the groups. Results are shown as the mean ± SEM and were represented * and # for was used where * p< 0.05; ** p< 0.01 and *** p< 0.001 for the differences among all groups in the respective time; and # p< 0.05 and ## p<0.01 for differences to the control group at the same time.
