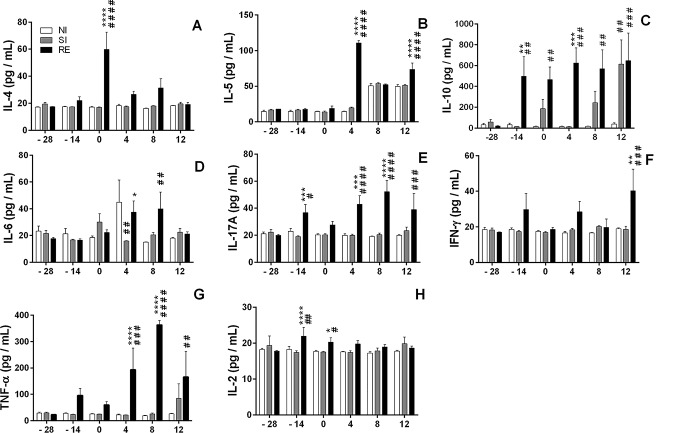
Fig 8. Systemic cytokine production profile from the first day to 12 days post-infection.
(A) IL-4, (B) IL-5, (C) IL-10, (D) IL-6, (E) IL-17A, (F) IFN-γ, (G) TNF-α and IL-2 (H). Two-way ANOVA test followed by multiple comparisons test were used to compare the variances between the groups. Results are shown as the mean ± SEM and were represented by ‘*’ and ‘#’. * p< 0.05, ** p< 0.01, *** p< 0.001; and **** p< 0.0001 are indicated to represent the differences compared with single-infected group in the respective time; and # p< 0.05, ## p< 0.01, ### p <0.001, and #### p< 0.0001 represent the differences compared with non-infected group.

