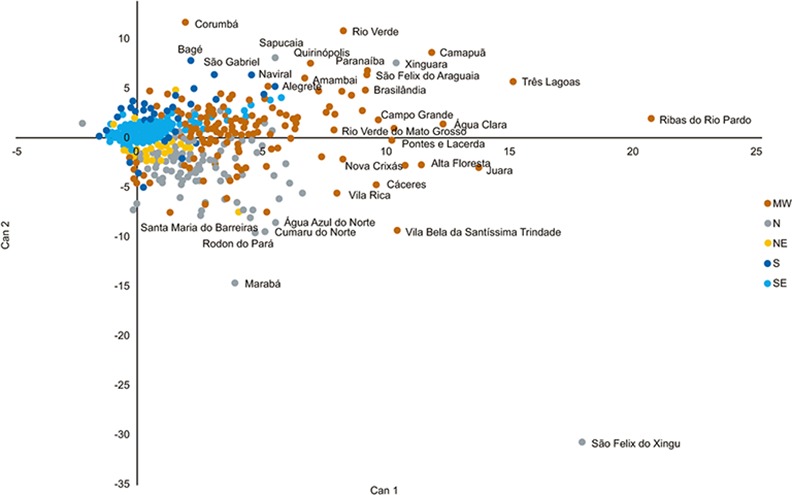
Fig 6. Canonical analysis of acceleration in cattle production in Brazil (N–North, NE–Northeast, SE–Southeast, S–South, and MW–Midwest).

(Can 1 and Can 2 are the first tow canonical scores for each municipality). Each point on the graph represents a municipality, with those that are named showing highest discriminatory values.
