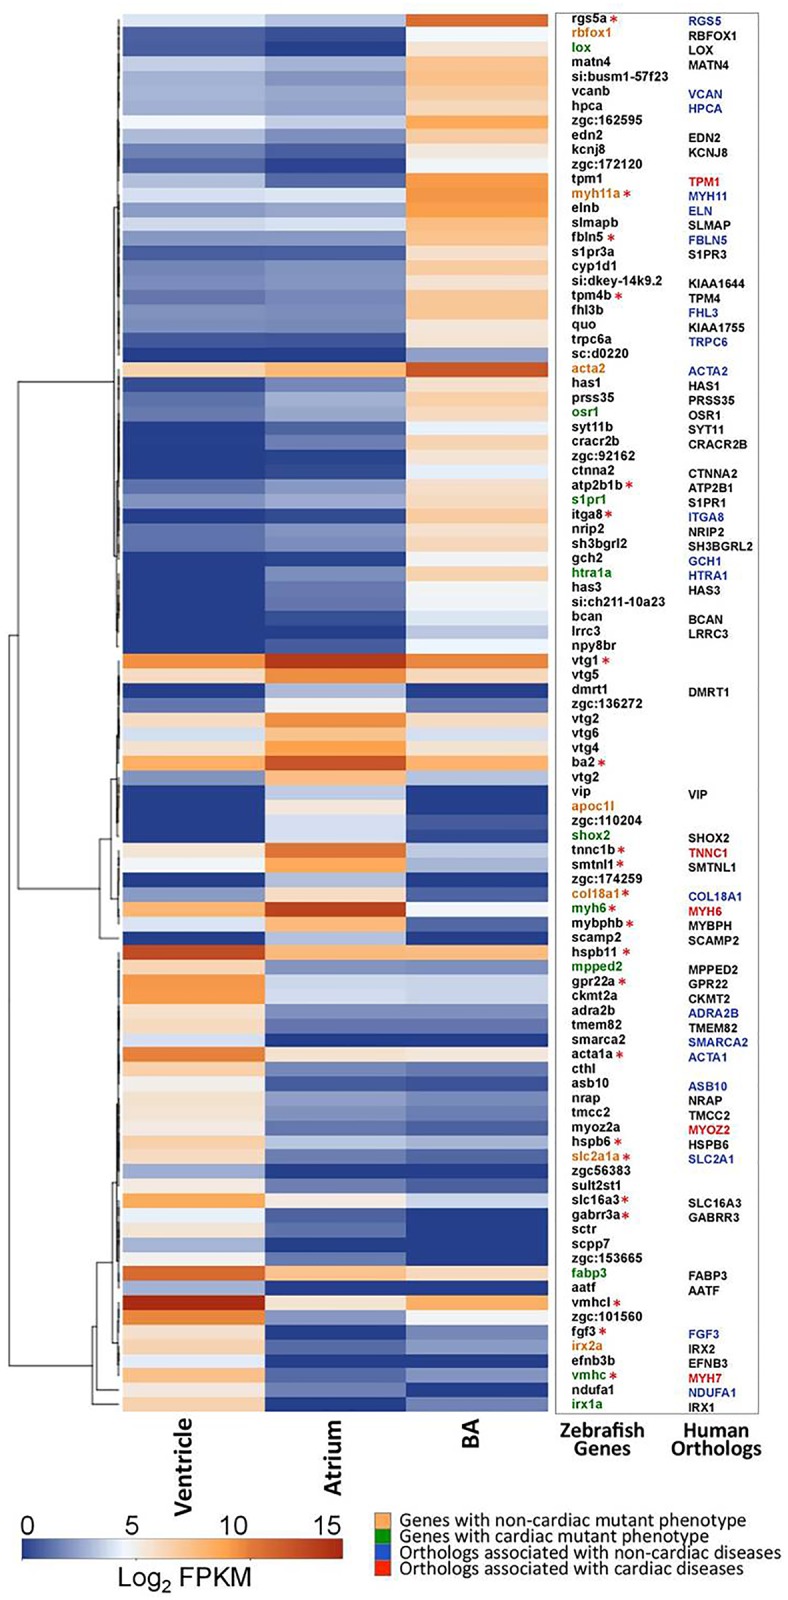
Fig 2. Differential expression of genes in the three cardiac chambers.

The heat map represents expression profile of 96 cardiac chamber-restricted genes. The first column in the adjoining table lists the corresponding zebrafish gene names which are colour coded to highlight those with mutant phenotypes. Genes marked with green colour signify those which have been identified with heart related mutant phenotypes. The second column lists the human orthologs known for these genes. Genes marked with asterisks (*) represent those mentioned in the text (Results & Discussion). Colour coding for the human orthologs highlights those which show disease associations. Orthologs marked with red colour are associated with cardiac disorders. The colour key represents transcripts in the range of 0 for transcripts with least expression to 15 for transcripts with maximum expression.
