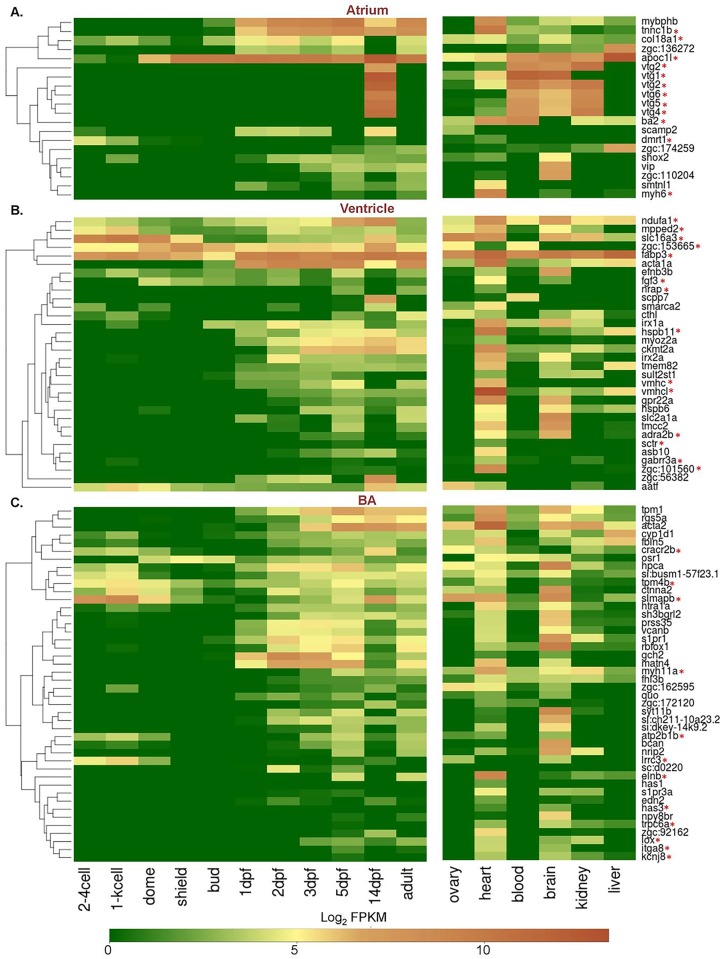
Fig 4. Developmental and adult tissue expression profiles of differentially expressed genes in the three cardiac chambers.
The heat maps represent spatiotemporal expression profile of 96 chamber-restricted genes across 11 zebrafish developmental stages and 6 adult tissue types. The colour key represents transcripts in the range of 0 for genes with least expression to 10 for transcripts with maximum expression. Genes marked with asterisks (*) represent those mentioned in the text (Results & Discussion).

