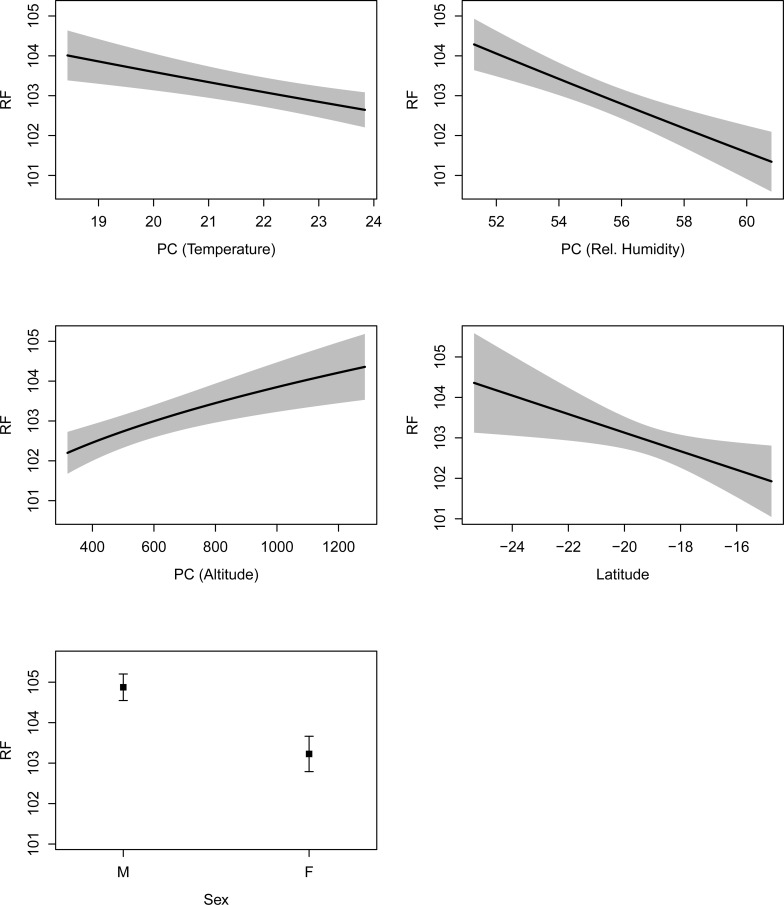
Fig 4. Predictive modelling plots showing how resting frequency (RF) in Rhinolophus swinnyi responded to environmental variation and sex.
Abbreviations: e.g., PC (Altitude) represents a principle component generated by fixing mean-annual-temperature and relative humidity (rel.humidity) to their across-site-means whilst altitude is allowed to vary. The shaded areas and error bars represent 95% confidence limits. The final best model (with only variables shown significant after ANOVA on the best model) was used for the modelling.

