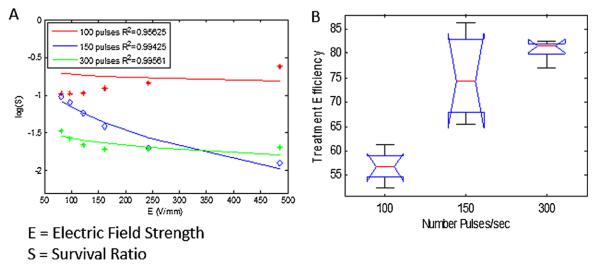
Figure 4.
Log (Survival Ratio) of bacteria per treatment group. (A) Bioluminescent values measured from N = 3 mesh pieces per group. The average of all treatments per pulse group compared to the theoretical Weibull distribution as a fucntion of the electric field strength, is demonstrated. Survival rate decreases as the number of pulses and electric field strength increase. (B) An ANOVA test reveals that the P-value between the different conditions (pulse number) is 0.000056, which indicates that treatment efficacy directly correlates to number of pulses delivered. Treatment efficiency is defined by the % of eradicated bacteria, as measured by the % of bioluminescence reduction at the specific location.

