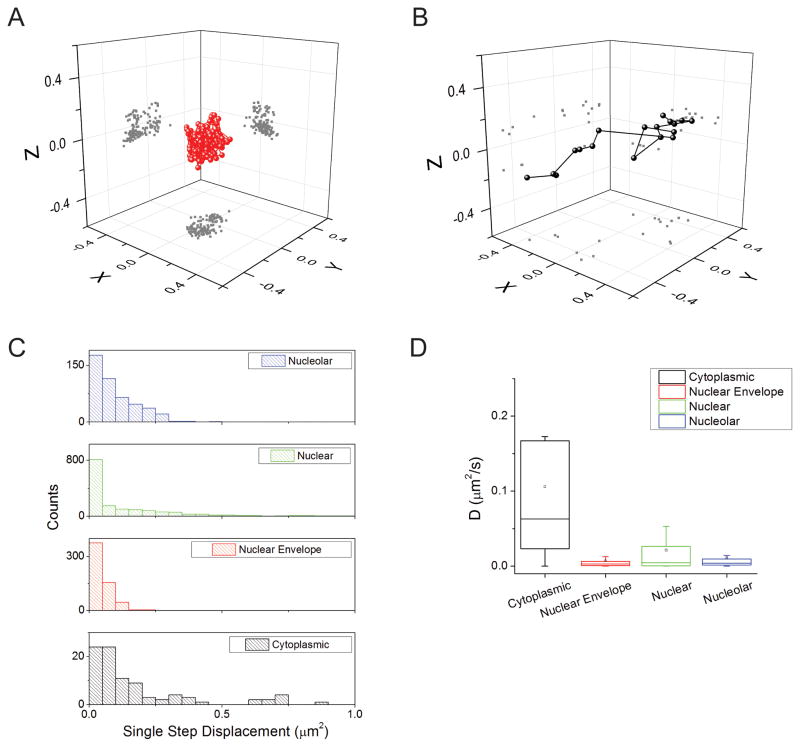
Fig. 3.
Single-molecule tracking of HIV-1 genomic RNAs. (A,B) Examples of individual trajectories of HIV-1 genomic RNAs (V1B-MS2) in HeLa MS2-NLS-mCherry cells at the nuclear envelope (A) and in the cytoplasm (B). The projections of the positions in two dimensions are shown as gray dots in the relevant planes. (C) Histograms of the speed (single step squared displacement) for HIV-1 genomic RNAs in the cytoplasm (black), at the nuclear envelope (red), in the nucleus (green), and in the nucleolus (blue). (D) Graph of the calculated diffusion coefficients of HIV-1 genomic RNAs in the cytoplasm (black), at the nuclear envelope (red), in the nucleus (green), and in the nucleolus (blue).

