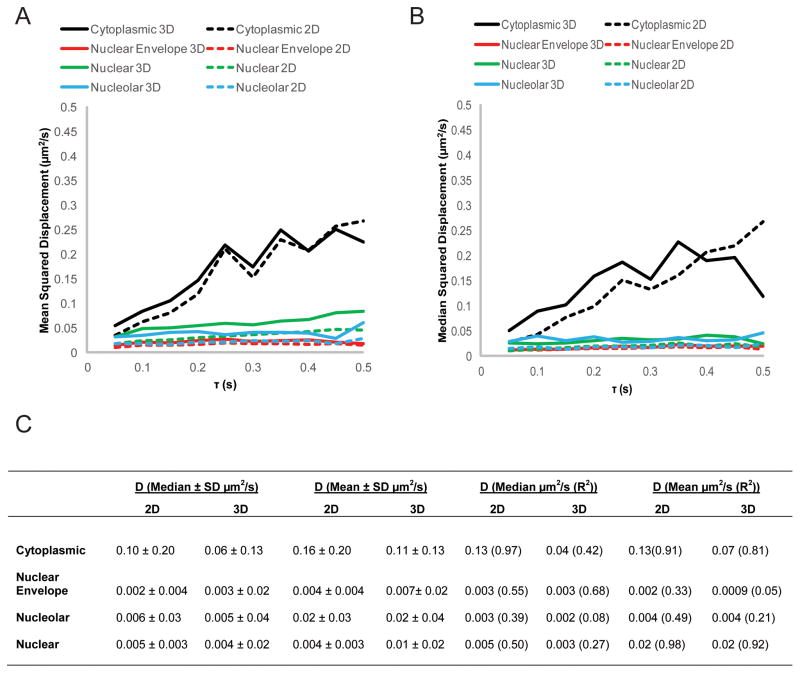
Fig. 4.
Apparent diffusion coefficients of HIV-1 genomic RNAs. (A,B) Cumulative mean (A) or median (B) squared displacement plots of HIV-1 genomic RNAs (V1B-MS2) in HeLa MS2-NLS-mCherry cells calculated based on either 2D or 3D trajectories. (C) Table of the values for the apparent diffusion coefficient (D) of HIV-1 genomic RNAs either calculated by taking the median or mean value when D is calculated for each trace, or by calculating D from the cumulative mean or median squared displacement plots.

