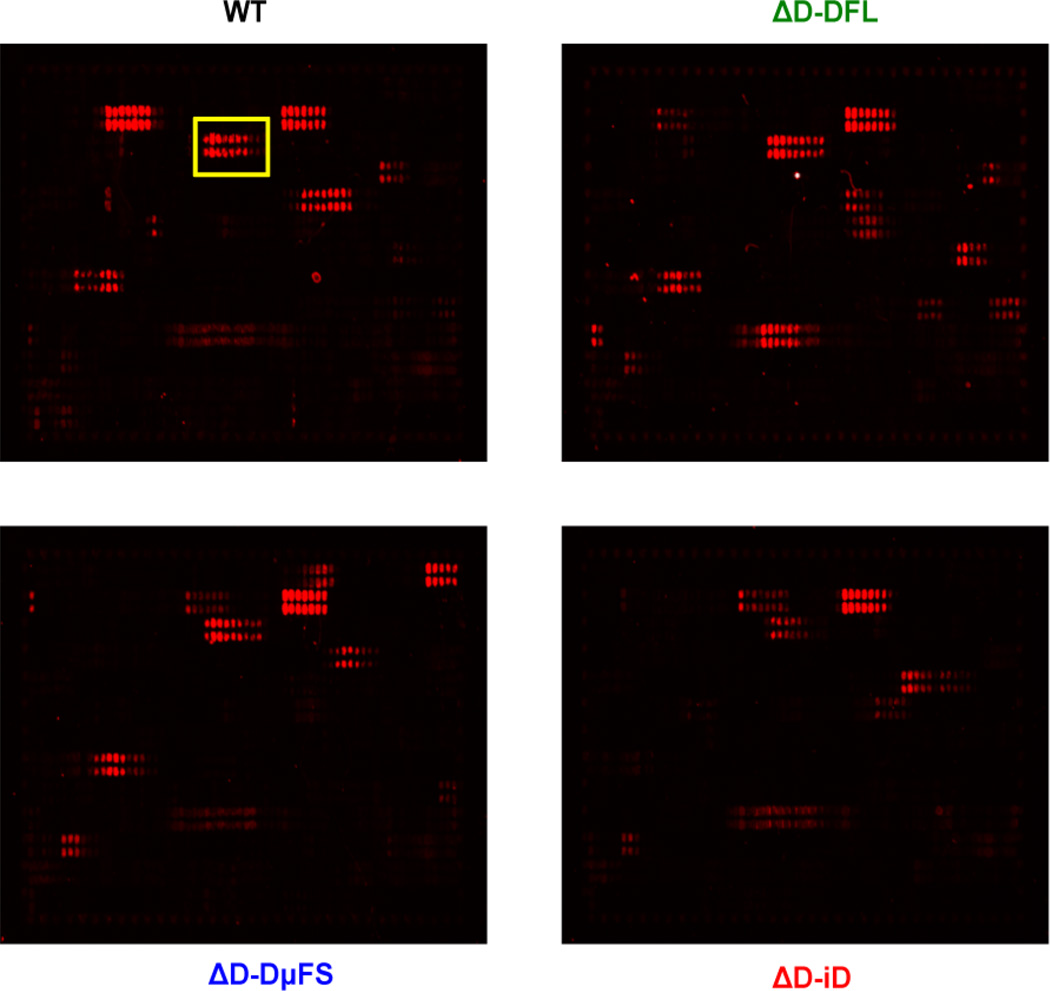
Fig. 3. Representative peptide microarray images.
One of three chips is shown as an example. The chips contained thirteen amino acid peptides with a twelve amino acid overlap spanning the entire gp160 sequence. Peptides were spotted in duplicate. The chips were incubated with WT, ΔD-DFL, ΔD-DμFS and ΔD-iD immune sera (1:1000 dilution) followed by staining with the secondary antibody F(ab´)2 goat anti-mouse IgG(H+L) conjugate at a dilution of 1:5000 and read-out at a scanning intensity of 5 (red). Read-out was performed with a LI-COR Odyssey Imaging System. The red dots represent the peptides with bound antibody, e.g. the boxed area shows the V1V2 epitope. Quantification of spot intensities and peptide annotation were done with PepSlide® Analyzer.

