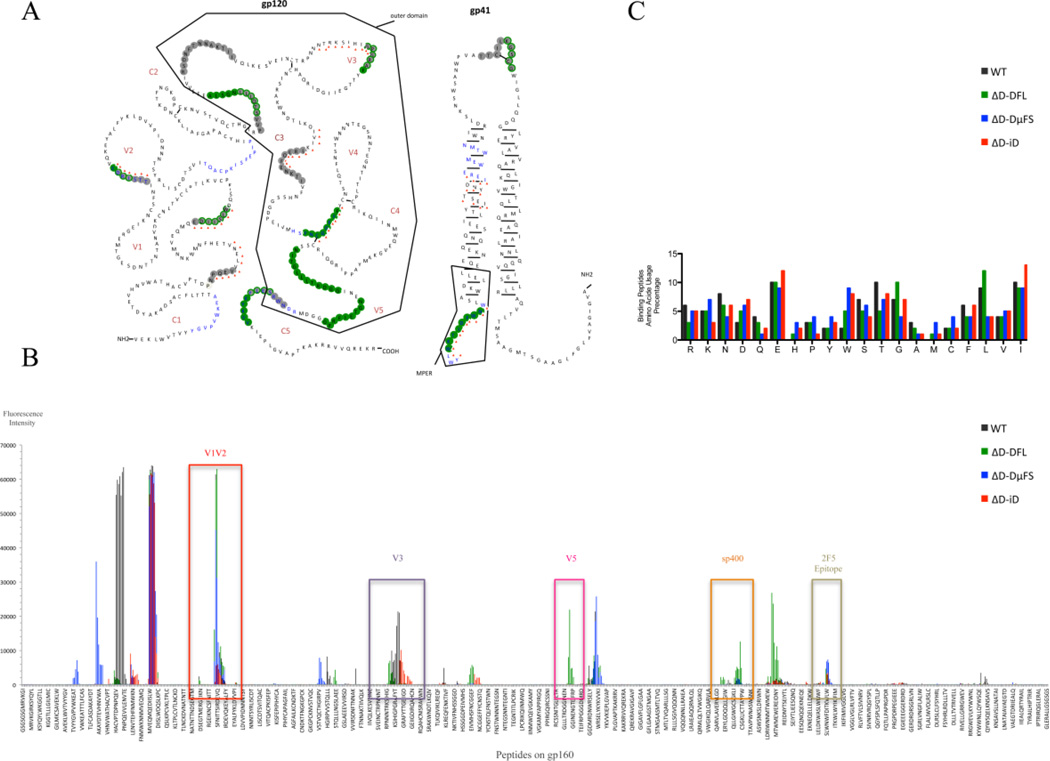
Fig. 4. Antibody binding to HIV-1 JR-FL gp140 linear epitopes.
Peptide binding data from sera obtained after the second and fourth immunizations were combined for these analyses. (A) Illustration of the peptides bound by the various sera superimposed on the JR-FL gp140 secondary structure. The residues bound by sera from the different mouse strains are color-coded: WT (grey), DFL16.1 (green), ΔD-DμFS (blue), ΔD-iD (red triangle). The symbolic spatial structures of HIV-1 JR-FL gp120 and gp41 are plotted based on Binley’s published research (Binley et al., 2000). (B) Response intensity chart of the bound peptides for each mouse strain. The bound peptides, which are located in the positions of V1V2, V3, V5, Sp400 and 2F5 epitopes, are indicated in the figure to illustrate the overlapping binding of the positive natural epitopes in Fig. 2. (C) Amino acid usage percentage of the bound peptides. The average frequency of the different amino acids present in the bound peptides was calculated by Prism GraphPad® 5. The measurement methods are in a supplementary Microsoft Excel table.

