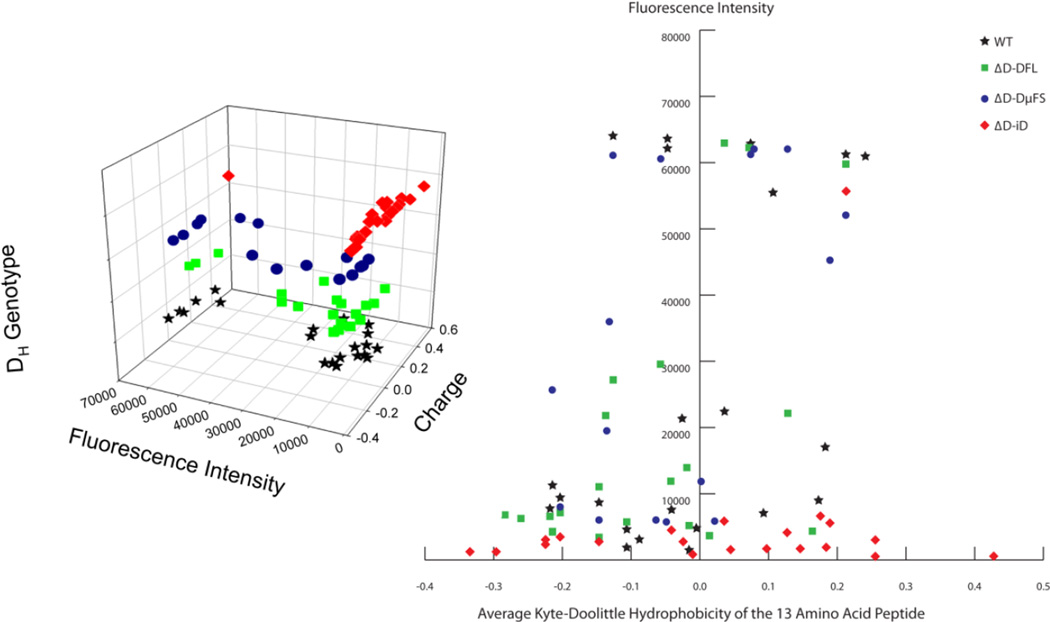
Fig. 5. Responses of mice of different genotypes versus intensity and charge of the bound peptides.
(Left) 3-D visualization of the response intensity to HIV envelope peptides with their charge and corresponding DH genotype. (Right) 2-D visualization of the mouse strain preference, charge and reaction intensity.

