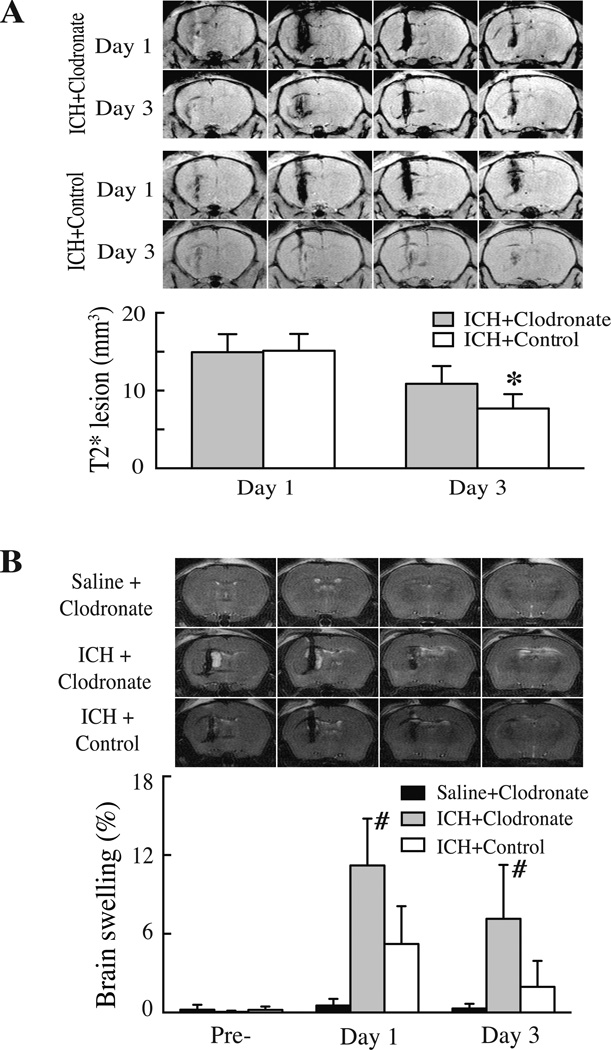
Figure 5.
(A) T2* weighted MRI showing the lesions in the ipsilateral hemisphere at days 1 and 3 after injection of 30µl blood from CD47 KO mice mixed with 5µl clodronate liposome or control liposome into the right basal ganglia. Bar graphs show quantification of lesion volumes. Values are mean ± SD; n=7 for each group, *p<0.05, vs. control group. (B) T2 weighted MRI showing brain swelling at day 1 after injection of 30µl blood from CD47 KO mice mixed with 5µl clodronate liposome or control liposome or saline with clodronate. Bar graphs show quantification of brain swelling ((ipsilateral-contralateral hemisphere/ contralateral hemisphere)×100%)) at days 0, 1 and 3. Values are mean ± SD, n=7 for each group, #p<0.01 vs. the other groups.

