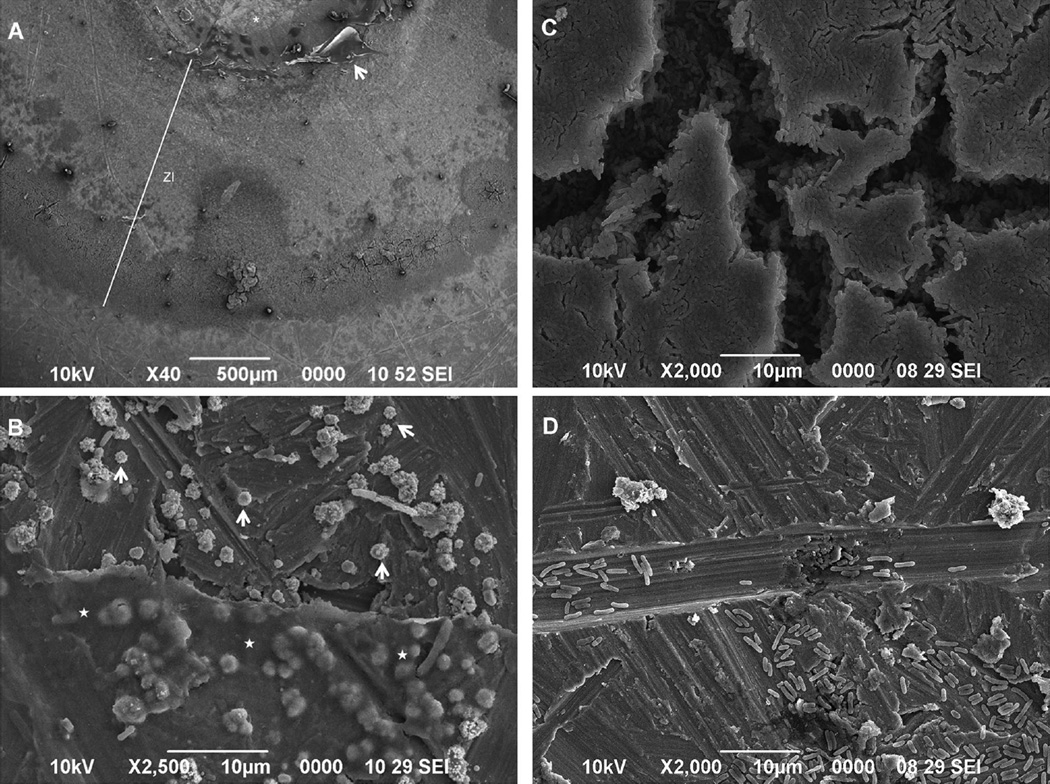
Figure 5.
SEM analysis depicting bacterial distribution and morphology along the Ti disc surface covered with Aa after contact with the 0.5 mg/ml SL alginate microsphere. (A) Interfaces produced by the contact of the 0.5 mg/ml SL alginate microspheres. Zone of inhibition, ZI; surface previously covered by the microsphere, *; residues of hydrogel, arrow. (B) Closer view of residue of the hydrogel. Round shaped Aa (arrows) suggest bacterial death near the biomaterial (⋆). (C) Aa aggregates in the outer part of the ZI. (D) Aa distribution on the Ti disc surface outside the ZI.

