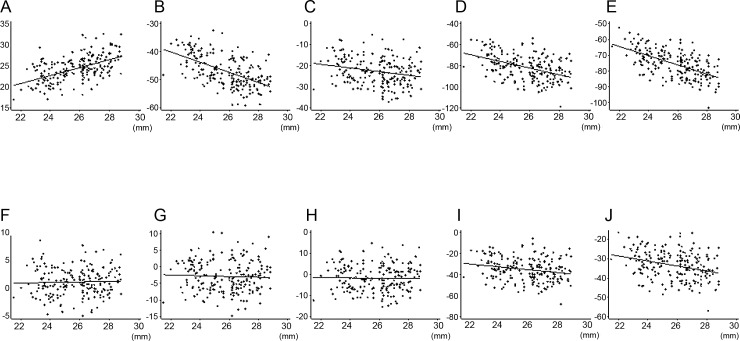
Fig 7. Partial residual plots showing the relationship between axial length and the average thickness of each retinal layer in total analytical area controlling for the effects of other five explanatory variables.
Component plus residual was plotted against axial length for each retinal layer. A, F: retinal nerve fiber layer, B, G: ganglion cell layer plus inner plexiform layer, C, H: ganglion cell complex, D, I: total retina, E, J: outer retina. A—E: magnification uncorrected analytical area, F—J: magnification corrected analytical area. The other five explanatory variables = age, gender, eye laterality, corneal curvature, and signal strength index.

