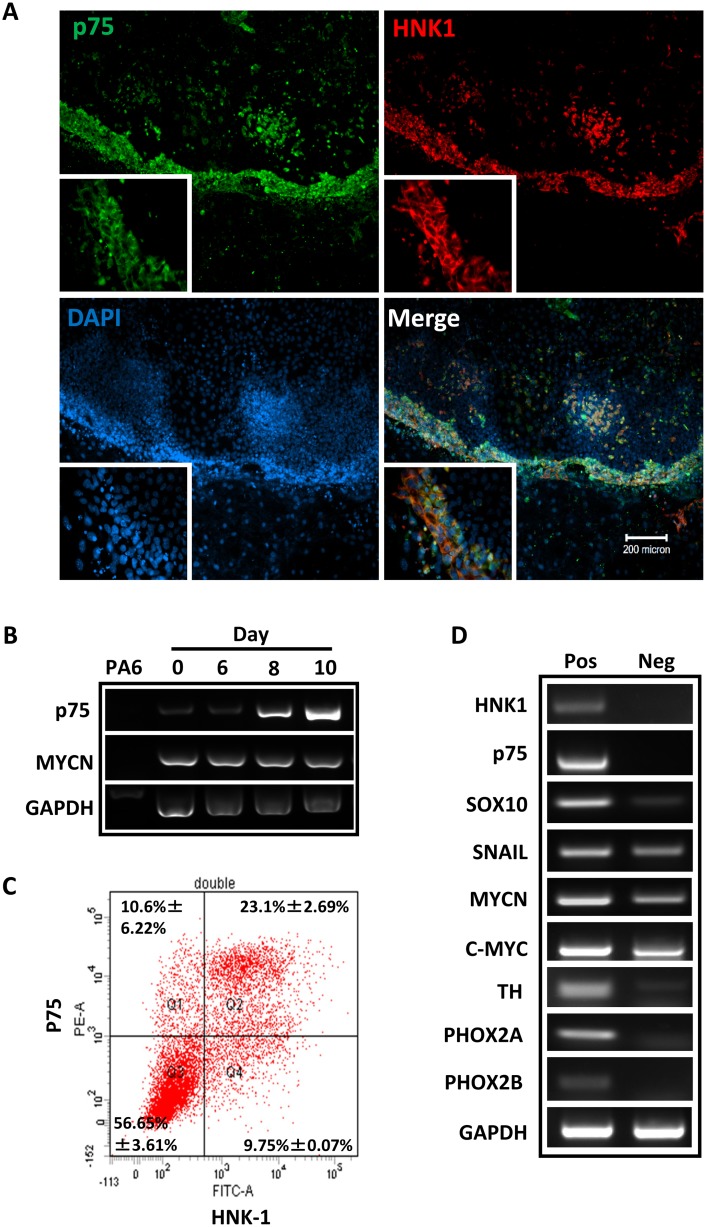
Fig 2. Induction and isolation of hNCSCs from hESCs.
(A): A colony of H9 hESCs double stained for p75 (green) and HNK-1 (red) after one week of culture on PA6. Note that the expression of p75 and HNK-1 is outside or at the edge of the hESC colony, scale bar = 200μm; (B): Reverse transcription-polymerase chain reaction analysis (RT-PCR) of p75 expression, note that the expression of p75 is gradually increased up to day 10; (C): Analysis of H9-derived p75+ and HNK1+ cells by FACS analysis. The dot plots are representative of three independent experiments; (D): Different gene expression profiles are displayed in p75+ and p75- populations as assessed by RT-PCR. Note that p75+ cells express markers of NCSC and sympathetic neurons. The image is the representative of three independent experiments.

