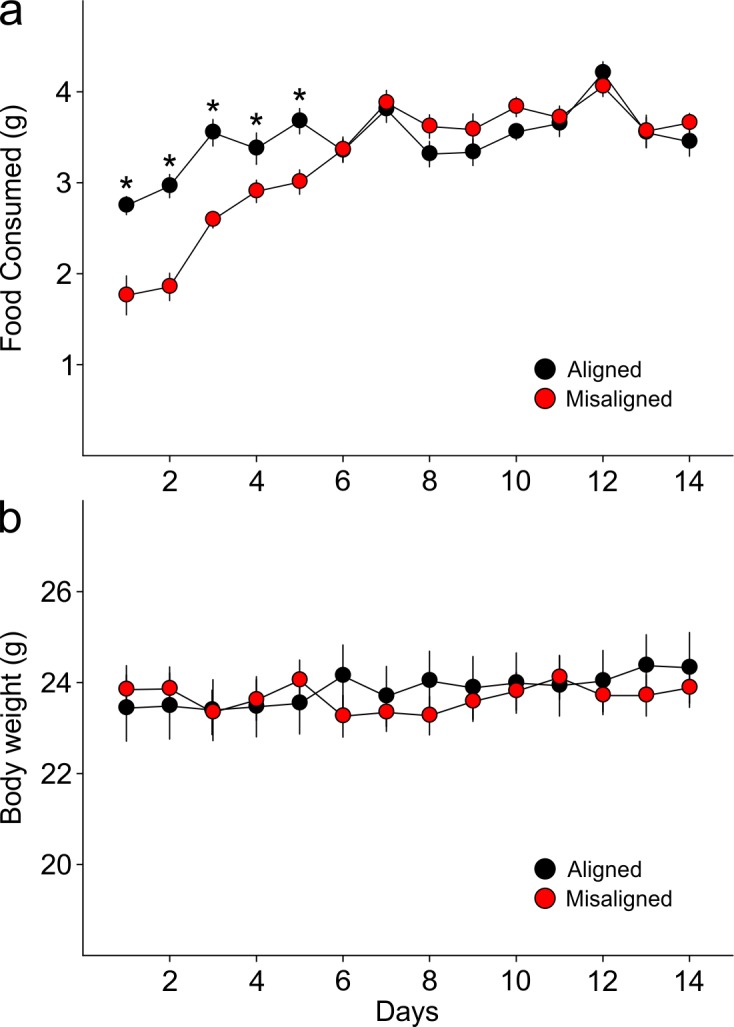
Figure 2. Food pellets in the automated feeding chambers were weighed daily to determine the amount of food consumed.

(a) Misaligned mice caught up with aligned mice in daily food consumption by day 6 of scheduled feeding (p = 0.9) and did not differ in food consumption subsequently (day 6–14 post hoc p > 0.2). (b) Mice were weighed daily prior to food access. Body weights between treatment groups did not differ significantly through the duration of scheduled feeding (two way ANOVA p = 0.3). Line graphs represent the mean ± SEM (n = 16 per treatment).
DOI: http://dx.doi.org/10.7554/eLife.09460.004
