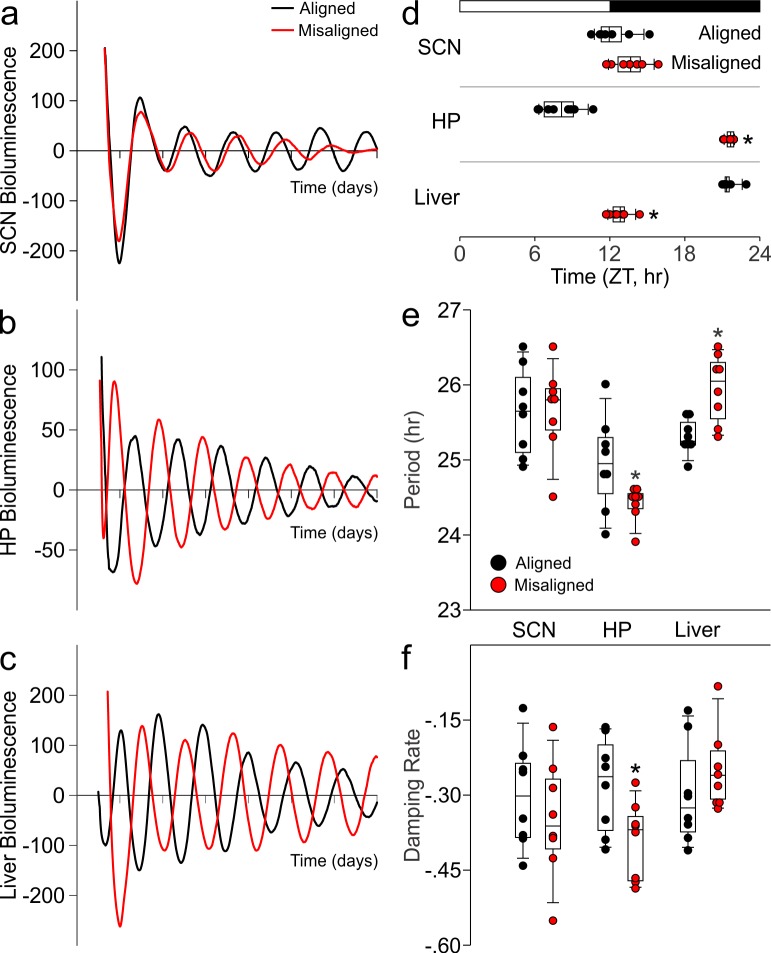
Figure 4. Differential impact of misaligned feeing on PER2-driven rhythms in bioluminescence of the SCN, hippocampus and liver (n = 8 per treatment).
Representative examples of baseline-subtracted traces of PER2-driven bioluminescence in the SCN (a), hippocampus (HP; b), and liver (c) explants from aligned (black) and misaligned (red) mice. (d) Phase relationship between the first calculated peaks of ex vivo bioluminescence plotted against time of the prior lighting cycle (ZT) shows a significant phase change in the HP and liver. (e) Period of bioluminescence rhythms were determined by sine wave fitting. (f) Damping rates were determined from 6 days in culture. *denotes significant differences (p < 0.05) between aligned and misaligned samples. Box and whisker plots display the median as a line, the 25th to 75th percentiles, and the 10th to 90th percentiles respectively.
DOI: http://dx.doi.org/10.7554/eLife.09460.009

